約6分で読めます
PdM
チャートから見えてくるスクラムカイゼン
自己紹介
ご覧いただきありがとうございます!
KINTOテクノロジーズ(以下、KTC)のプロジェクト開発部でエンジニアをしている三上裕太郎です
今年の9月入社で普段はフロントエンドエンジニアとして「KINTO FACTORY」の開発業務を行っています
今回、「アジャイル」をテーマに自分のこれまでの経験とKTCに入社してからの取り組みを執筆させていただきます
話すこと
タイトルにもある通り、私のチームのアジャイル開発において、バーンダウンチャートが右肩上がりしている(縁起イイネ👍
という状態に対して、正しく進捗管理を機能するために何を取り組んできたかをお話しします
本編
進捗管理のあるべき姿
バーンダウンチャートは残りの作業量が減少していく様子が一目で分かるようになっており、
- ステークホルダーへの進捗報告
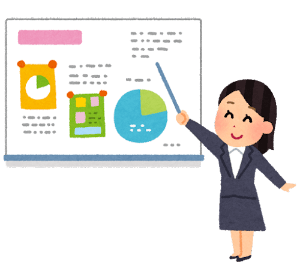
- 開発者にとっての視覚的なモチベーション維持
- タスクのストッパー早期発見
- チームの協力と連携を促進
といった効果やメリットが期待できます
現状の課題定義
上記を踏まえて、私のチームの1スプリントのバーンダウンチャートを取り上げ、感じる課題をまとめてみます
改善前のバーンダウンチャート
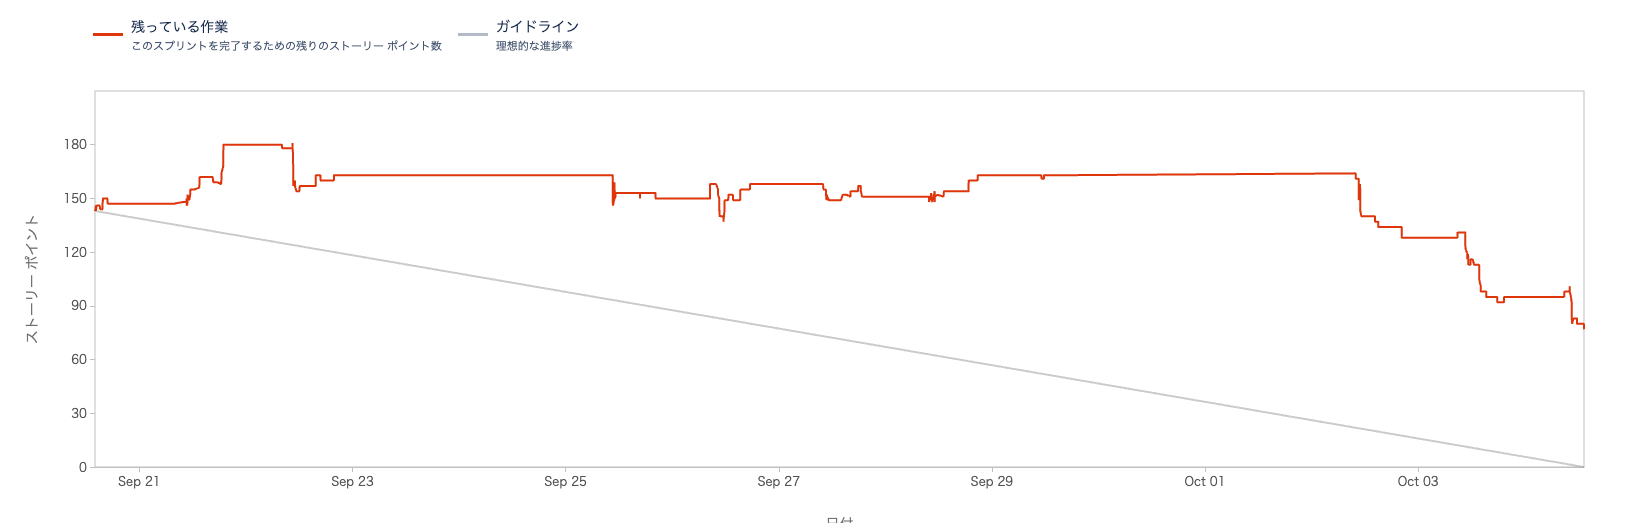
作業は進んでいくので当然最終的にグラフは下がっていくのですが
不定期にあるグラフの上昇や終了時点の理想線との開きの大きさが目につきます
結論
ステークホルダーへの進捗報告
意図したグラフの上昇なのかどうかをチームで把握できていないため信用性が低い報告になってしまう
開発者にとっての視覚的なモチベーション維持
グラフに降下傾向がないため、成功体験が得られずモチベーション維持が難しい
タスクのストッパー早期発見
デイリーで進捗報告をしているので、タスクの進捗が遅れていることはチームで把握できているが、グラフからはタスクのストッパーが見えずタスクの進捗が滞っていることが分かりづらい
チームの協力と連携を促進
日頃のコミュニケーションは十分に取れているが、チャートを通じて協力や連携をとったケースは少ない
カイゼンのゴール
ゴールしたら終わりではないですが、分かりやすさをとってチームとしてあるべき姿をゴールと表現しました
この記事におけるゴールの定義は以下とします
- チャートを通じてタスクの進捗を把握、コントロールができていること
- グラフが上昇することを許容しつつ、上がった事由がチームで認識できていること
- 開発者各々がチャートを通じて達成感を得られること
- チーム全体の協力と連携が促進できていること
カイゼン開始後
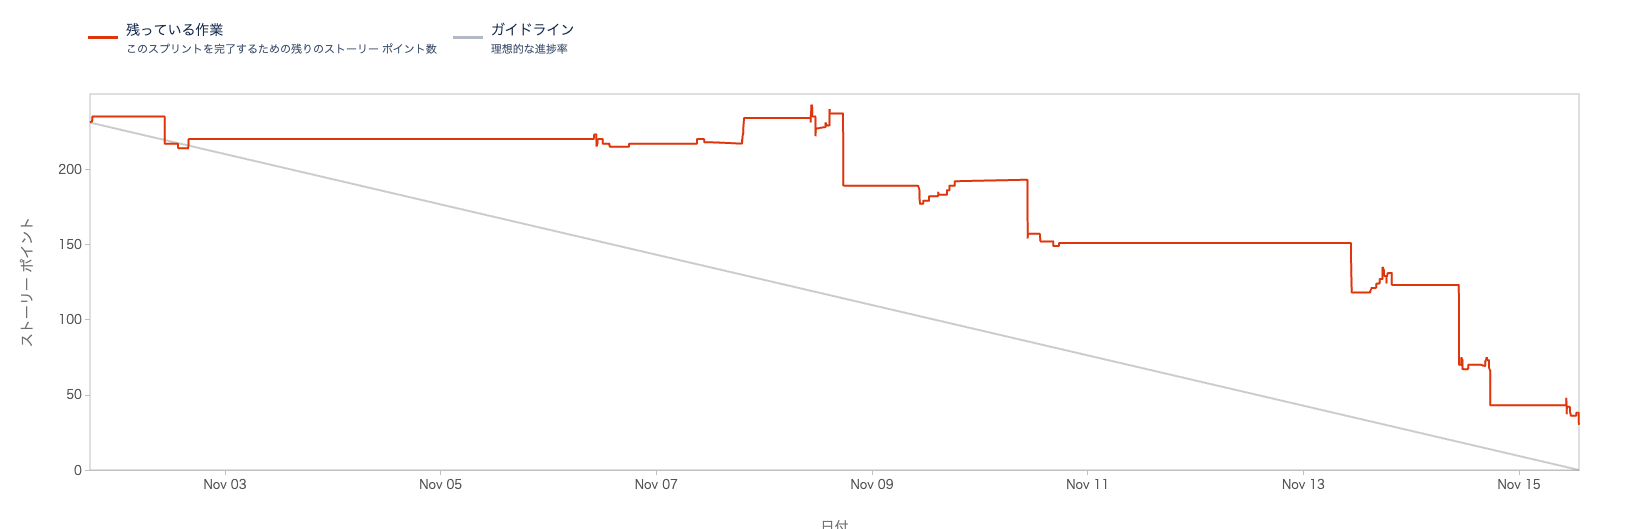
今も現在進行形でカイゼン中ですが現時点でチャートは改善傾向にあります
最新のバーンダウンチャート
やったこと1 ”意識” カイゼン
”とりあえずスプリントに積んでおこう” を止める
具体的なアクションは一つでしたが大きく効果があったと思います
この意識をチーム全体が持つようになったことでスプリント終了時点での理想線との開きを小さくすることに成功しています
加えてベロシティの精度が上がり、見積りの精度向上も期待できるようになりました
やったこと2 ”プランニング” カイゼン
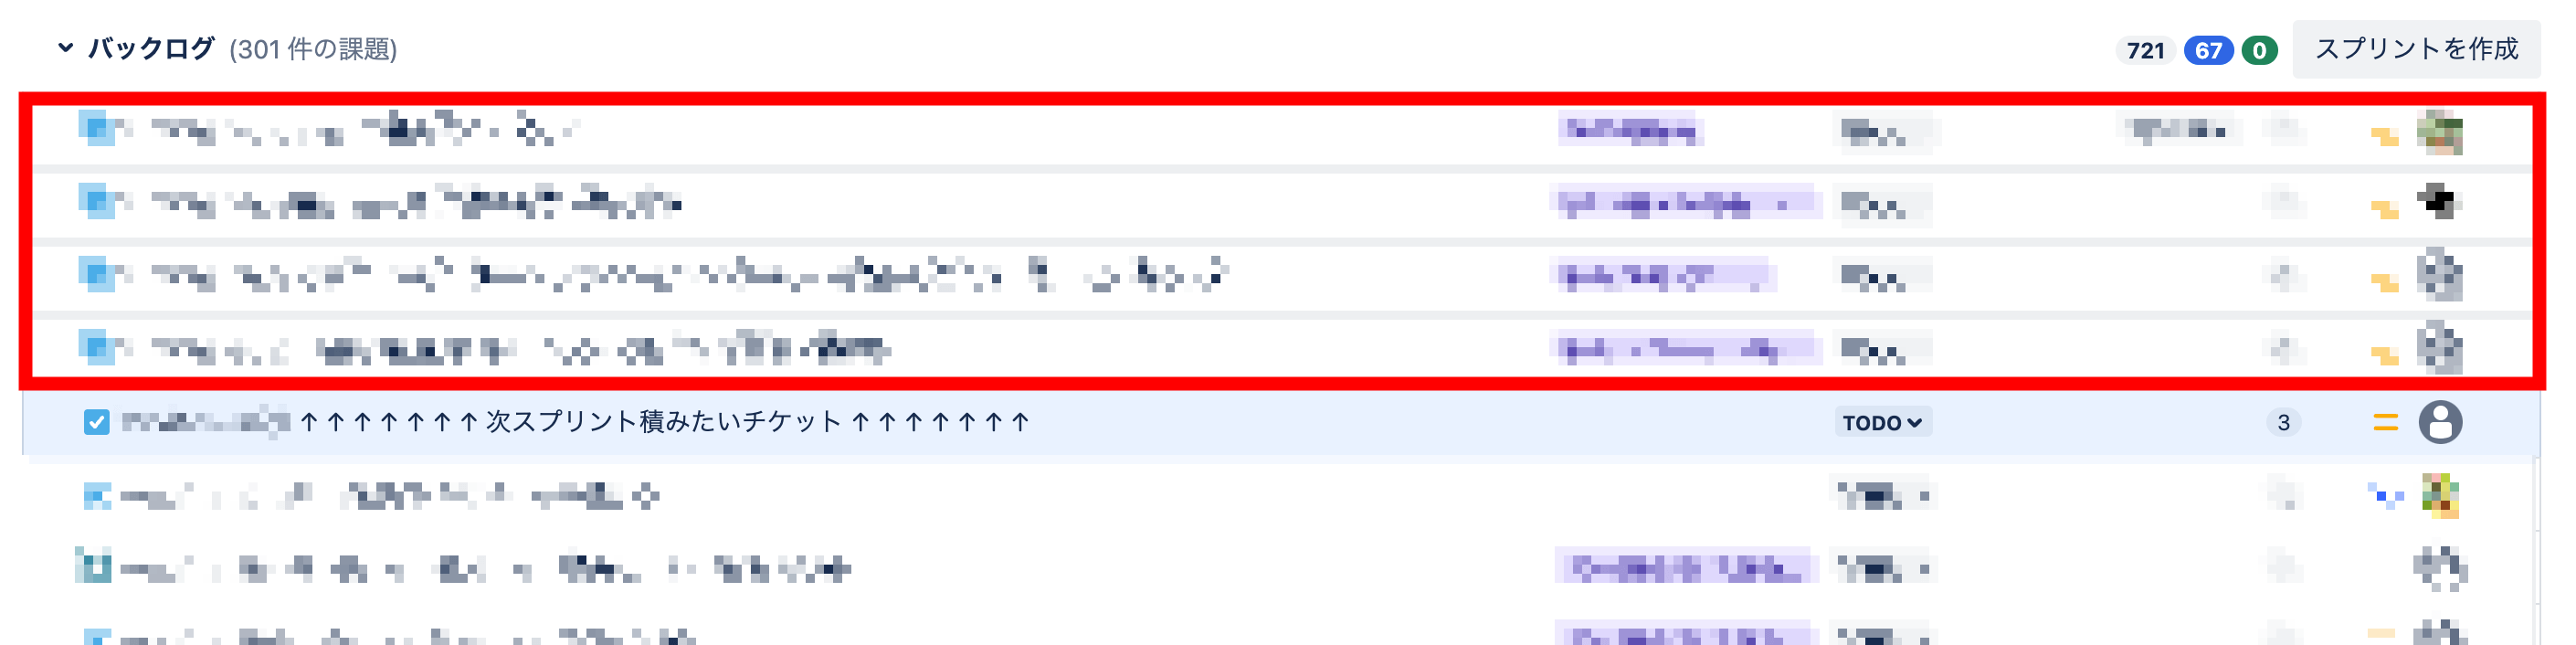
「次スプリントに積みたいチケット置き場」を設ける
スプリント中に追加で積まれるチケットの内訳は
- プランニング時の積み忘れ
- スプリント中に追加されたチケット
大きく分けるとこの2つでした
スプリント中に追加されるチケットには要因がいくつかあり短期的に改善するのは難しかったため、まずはスプリントへの積み忘れを予防するためのアクションを取りました
バックログ上に「次スプリントに積みたいタスク置き場チケット」を作成し、以上に並べたタスク(画像赤枠)についてプランニングで議論するようにしたところ以下の効果を実感しています
積み忘れの防止
プランニングまでにタスクをバックログ上部に動かしておくというアクション追加されたことで積み忘れがなった
タスク理解度の向上
1チケットに掛けるブレイクダウンの時間が増えたことでメンバー各々のタスク理解度が上がりました
適正な数のタスクをスプリントに積む
意識カイゼンにもつながりますがとりあえず積むのではなく、積むタスクを選別する機会を得られたので、適正な数のタスクをスプリントに積むことができるようになりました
やったこと3 ”カイゼン会議”
レトロスペクティブとは別に時間を設けてメンバー同士で日頃のスクラムに対する課題や改善点を話し合う時間を取りました
短〜長期的に取り組んでいく課題について話し、ネクストアクションを決めることで、チームの意識が高まりました
結果
ステークホルダーへの進捗報告
意図したグラフの上昇なのかどうかをチームで把握できていないため信用性が低い報告になってしまう
グラフの精度・信用性が向上したことで正確な進捗を報告できるようになった
開発者にとっての視覚的なモチベーション維持
グラフに降下傾向がないため、成功体験が得られずモチベーション維持が難しい
明確に降下傾向があり、成功体験が得られるようになった
スプリント中に追加されるチケットへのアクションは今後の課題
タスクのストッパー早期発見
デイリーで進捗報告をしているので、タスクの進捗が遅れていることはチームで把握できているが、グラフからはタスクのストッパーが見えずタスクの進捗が滞っていることが分かりづらい
引き続きデイリーで進捗報告を続けるグラフからストッパーを見えるようにする準備は整った印象
チームの協力と連携を促進
日頃のコミュニケーションは十分に取れているが、チャートを通じて協力や連携をとったケースは少ない
チャートを通じて協力や連携をとったケースはまだないが、誰がどのタスクを進行中なのかが以前より把握できるようになったので協力や連携が取れる体制づくりはできたと感じている
最後に
ご覧いただきありがとうございました
今回はチャートから見えてくるスクラムカイゼンについてお話ししました
チームでスクラムを継続していく上でカイゼンを繰り返すのはプロダクトだけでなく、チームやプロセスにも必要だと改めて実感しました
レポートやチャートを利用した客観的な改善はデータに基づいていて課題が発見されやすく、改善が目に見えるのでモチベーション維持にもつながります
皆さんのチーム”カイゼン”の一助になれば幸いです
最後に私の所属するKINTO FACTORYでは一緒に働く仲間を募集しています!
ご興味があればぜひ下記の求人をチェックしてみてください