Words Turn Into Worlds - The Magic of Amazon QuickSight Generative BI

Introduction
Hello. I'm Kazuki Morimoto from the Analysis Group in the Data Analysis Division.
I usually work in the Osaka office and handle analysis topics such as those from the retention project, credit project, used vehicle division and the MyRoute app. (I'd like to post the details separately on the Tech Blog in the future.)
In this article, I'd like to share with you what I've learned from using the preview version of "QuickSight Generative BI."
When I attended a AWS Generative AI Workshop that was held for TOYOTA Group companies last month, I was introduced to it and thought, "This could be quite useful!" so I gave it a try.
What you can find in this article
- An overview of QuickSight Generative BI
- I made a Sales Dashboard for a Ramen Subscription service Using Generative BI
- Good Points and Future Improvements
Contents not covered in this article - How to Use QuickSight
- Explanation of QuickSight Q
- How to Get Started with Generative BI ( This one was well written.)
Announcing Generative BI capabilities in Amazon QuickSight
What is Generative BI?
Simply put, it is a service that applies Amazon Bedrock's LLM to "QuickSight Q" to add a wider range of functions.
Originally, there was a function called "QuickSight Q" that enabled users to ask questions in natural language and receive answers with graphs.
Applying Amazon Bedrock's LLMs (Large Language Models) to it has empowered us to perform analyses based on natural language with a higher degree of freedom.
Quicksight Q
*QuickSight Q is available in the Tokyo region and many other regions in Japan. Reference
I Made a Dashboard Using Generative BI
Let's try out Generative BI right away.
I am going to create a dashboard imagining KINTO starting a Ramen subscription service.

*As a side note, KINTO is a mobility service company, not in the ramen business... Or at least not for now...
Goals
This time, I will refer to the "Sales" segment of the Dashboard published by CRISP, with the goal of creating the following two dashboards.
- Sales (by year and month)
- Contract plan composition ratio
Pre-preparation
As a pre-preparation, I will create a service overview and sample data of this Ramen subscription.
Service overview
I asked ChatGPT to come up with Ramen subscription plans.
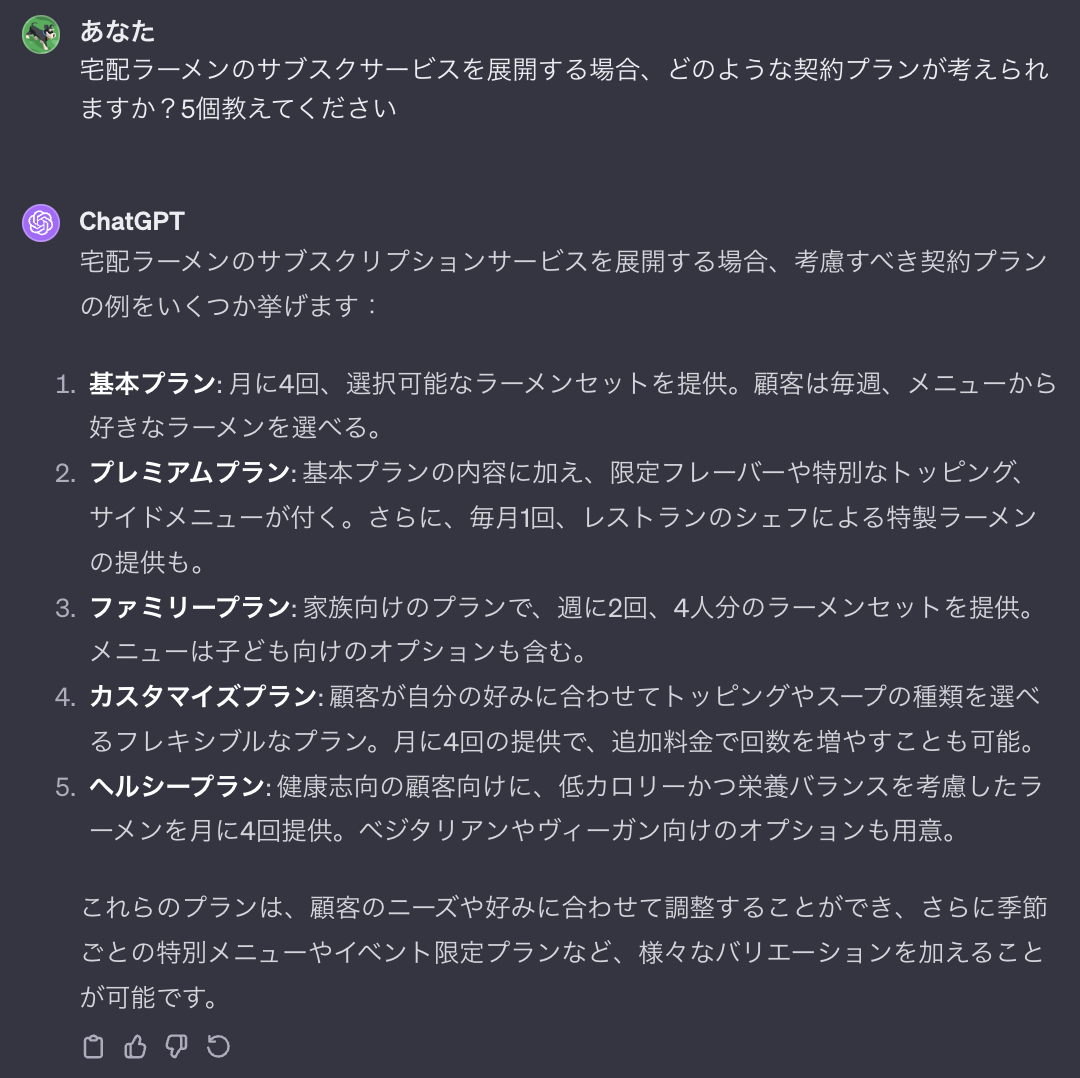
The plans turned out to be way better than I expected. LOL
I’m sold on that!
Create sample data
Next, I asked ChatGPT to create sample data with the following prompt. 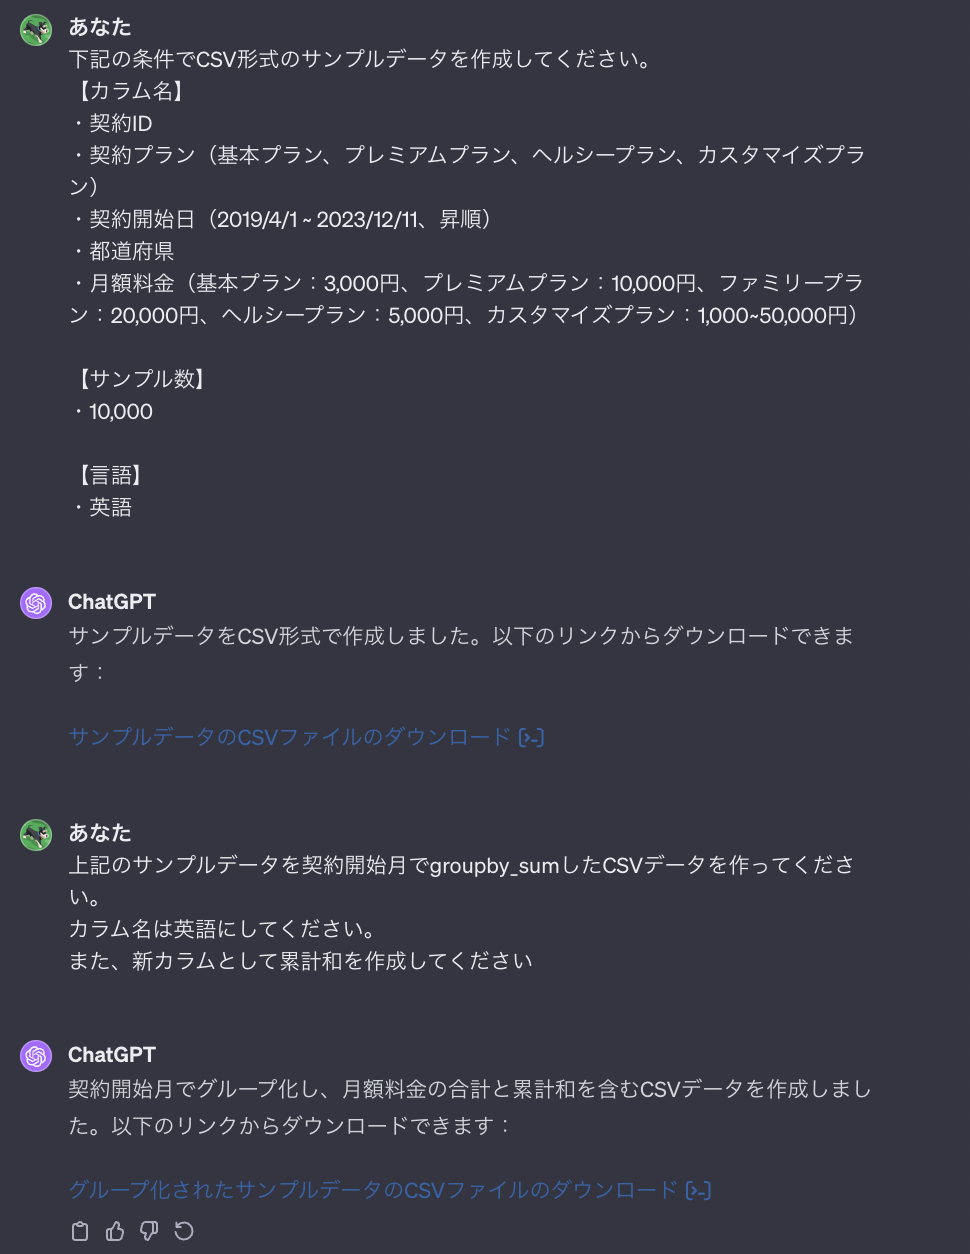
Results

It generated a CSV file with plausible sample data for real.
Practice
Now, I'd like to import the sample data I just mentioned into QuickSight to create charts.
This time, I'm trying it out using the Northern Virginia region in our in-house sandbox environment.
*As mentioned above, how to get started with generative BI is omitted.
1. Create a sales (by year and month) graph
First, I'd like to create a graph of sales (by year and month). Generative BI is only available in English (as of December 11, 2023), so I'll create prompts in English.
- Monthly sales estimates as of December 11, 2023
Enter the following prompt into "Build a visual."
Cumulative Sum(Yen) in 2023-12
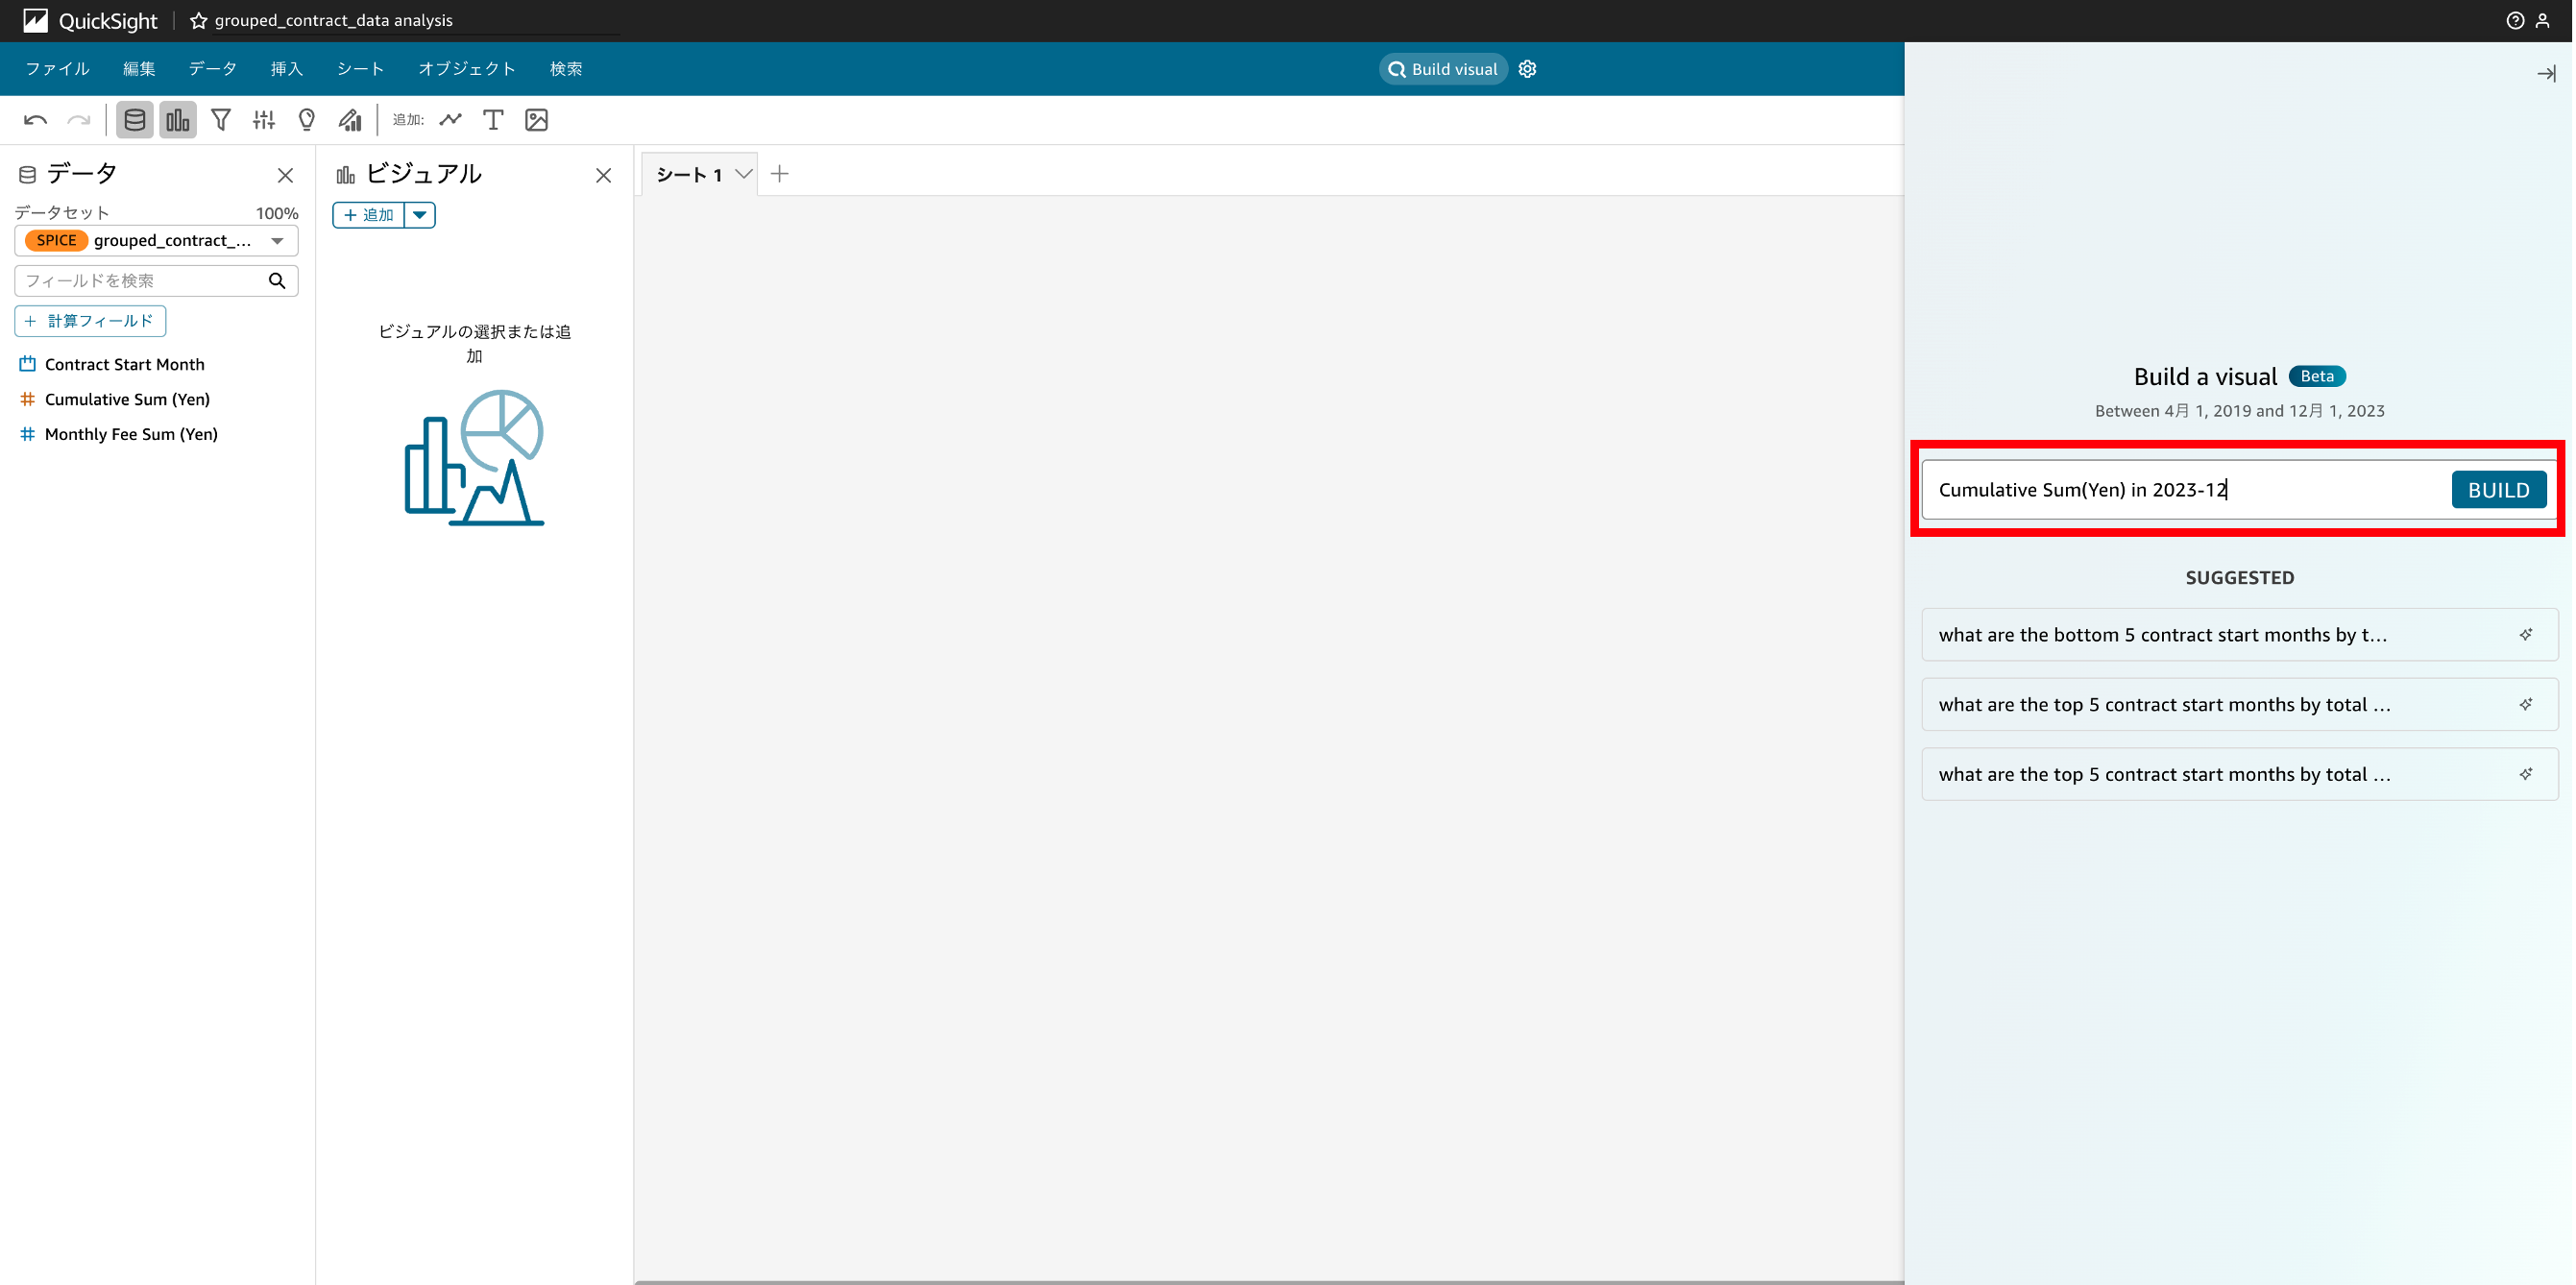
After pressing Build, the following board was created in about 3 seconds.
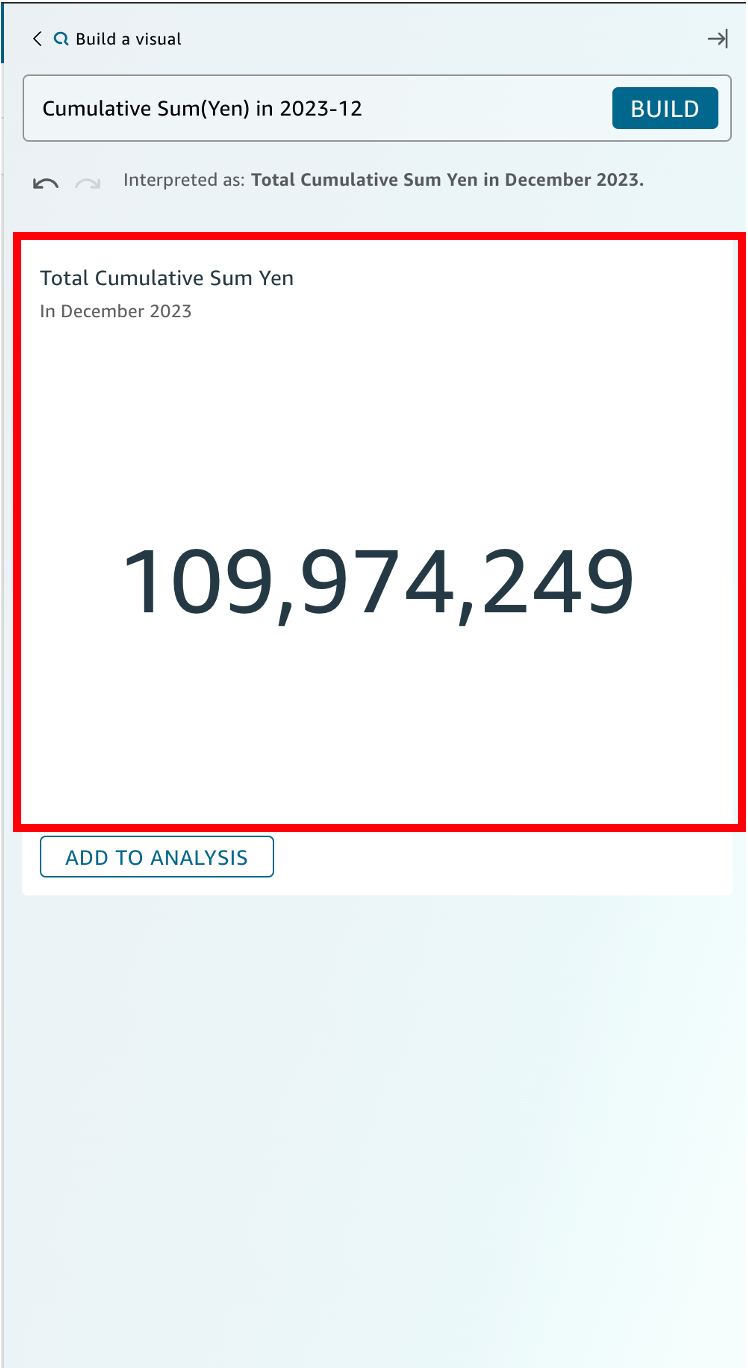
After confirming that the output is as expected, click "ADD TO ANALYSIS" to add it as a visual. 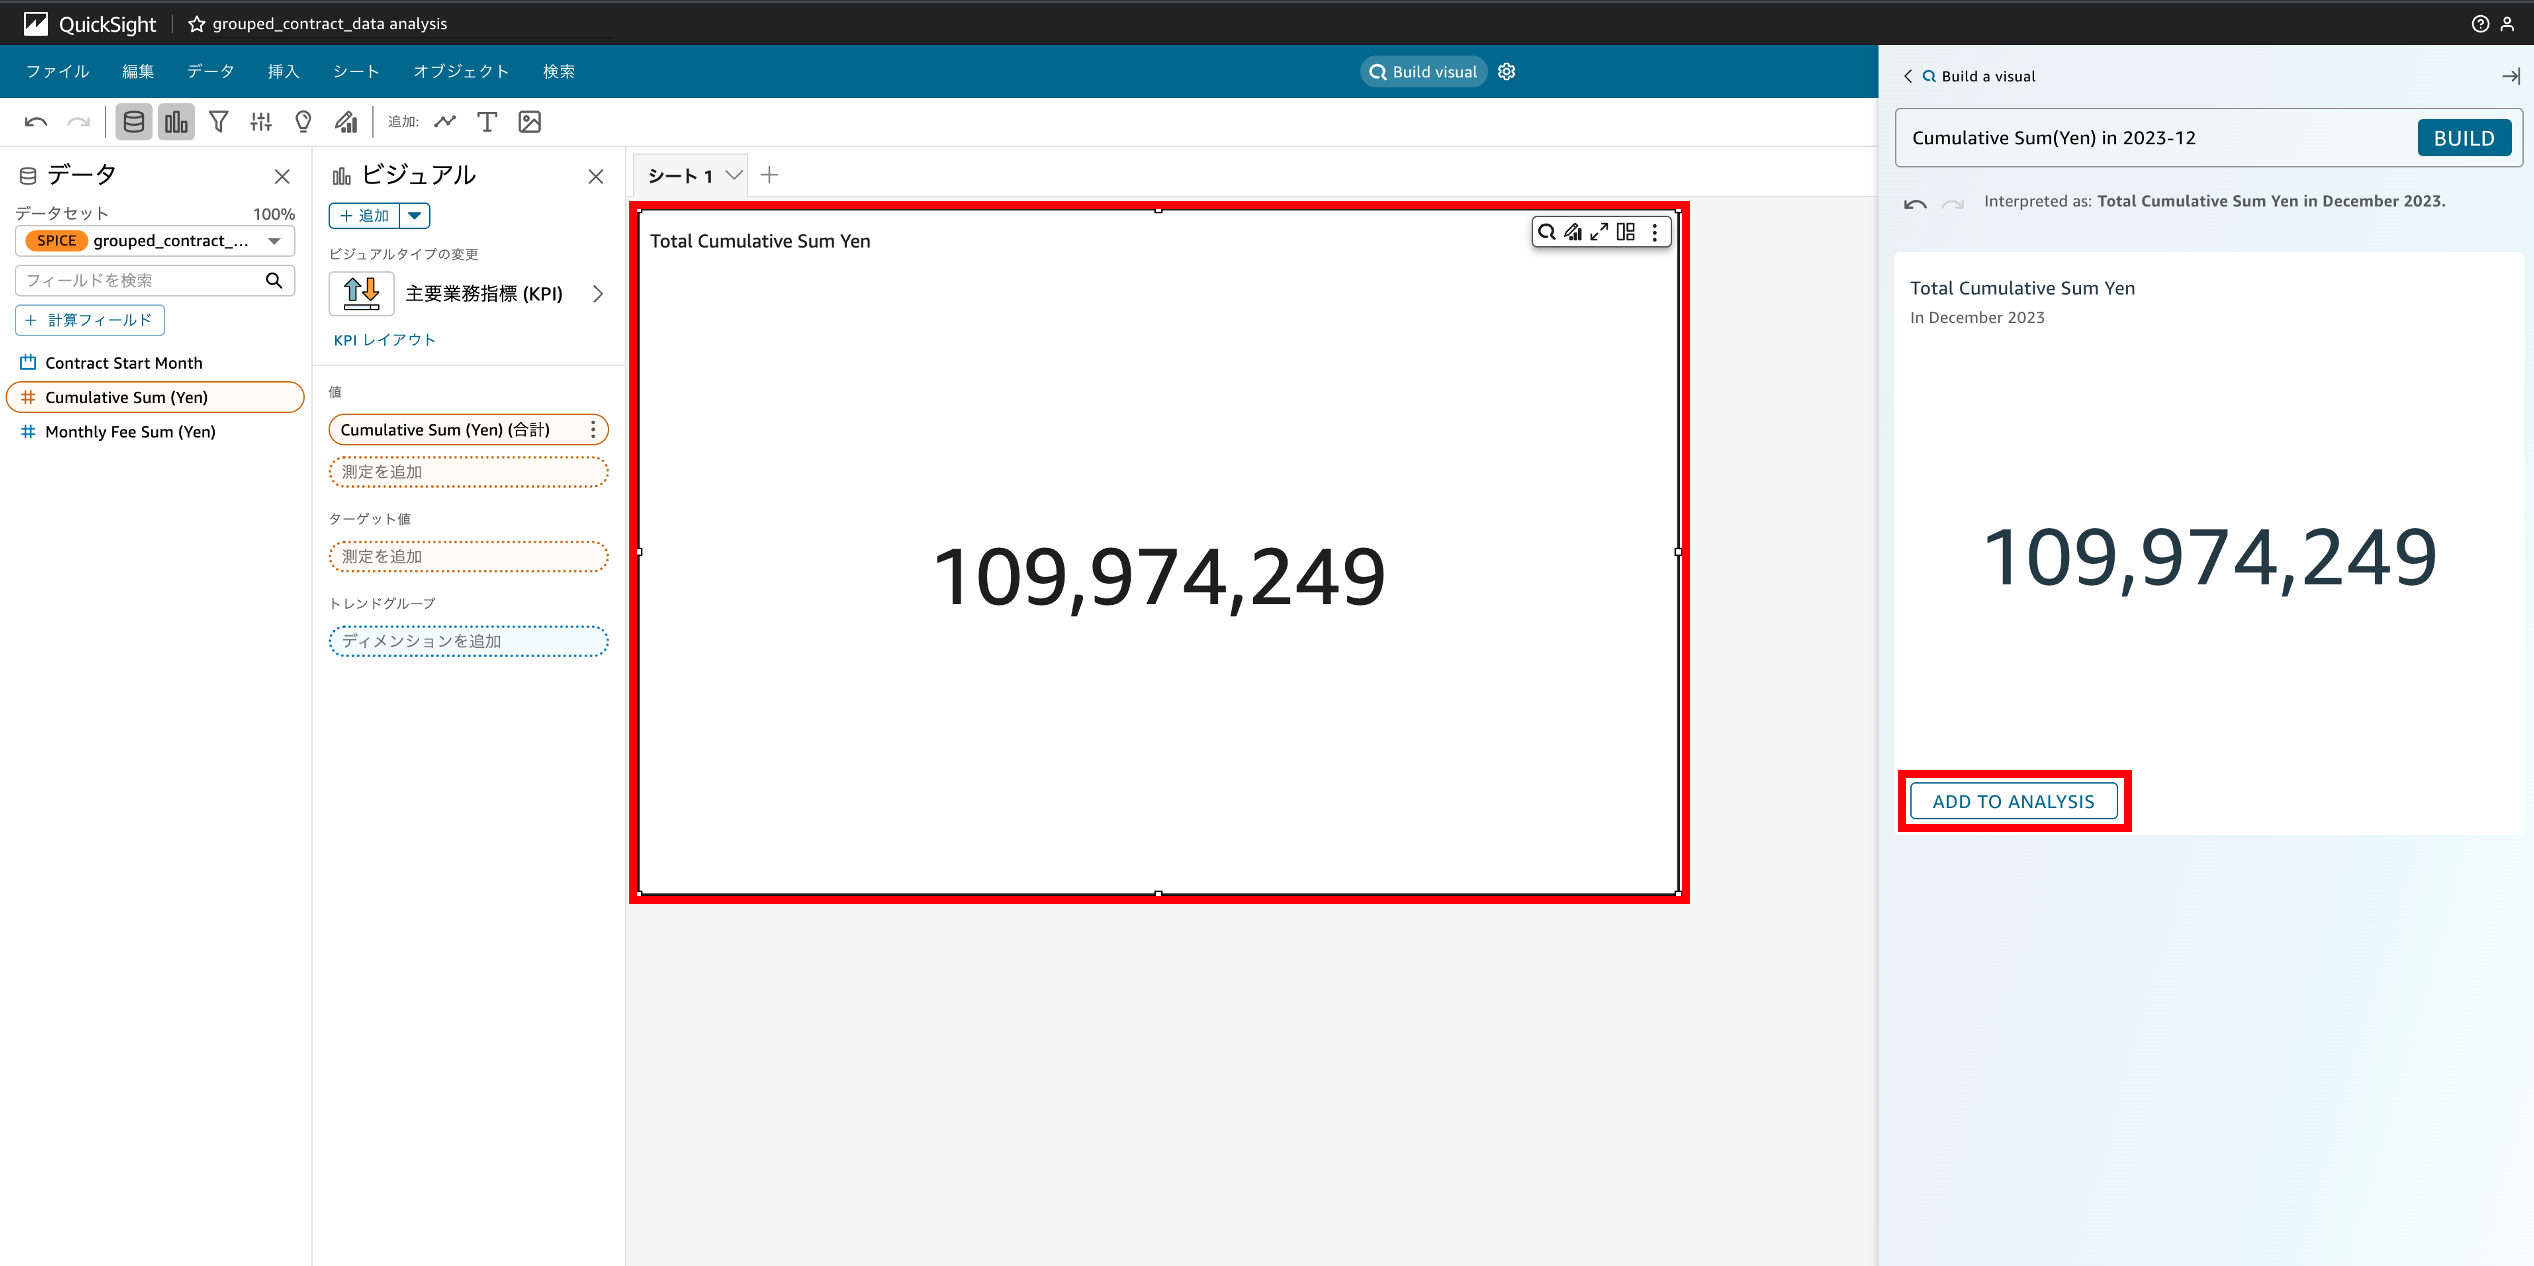
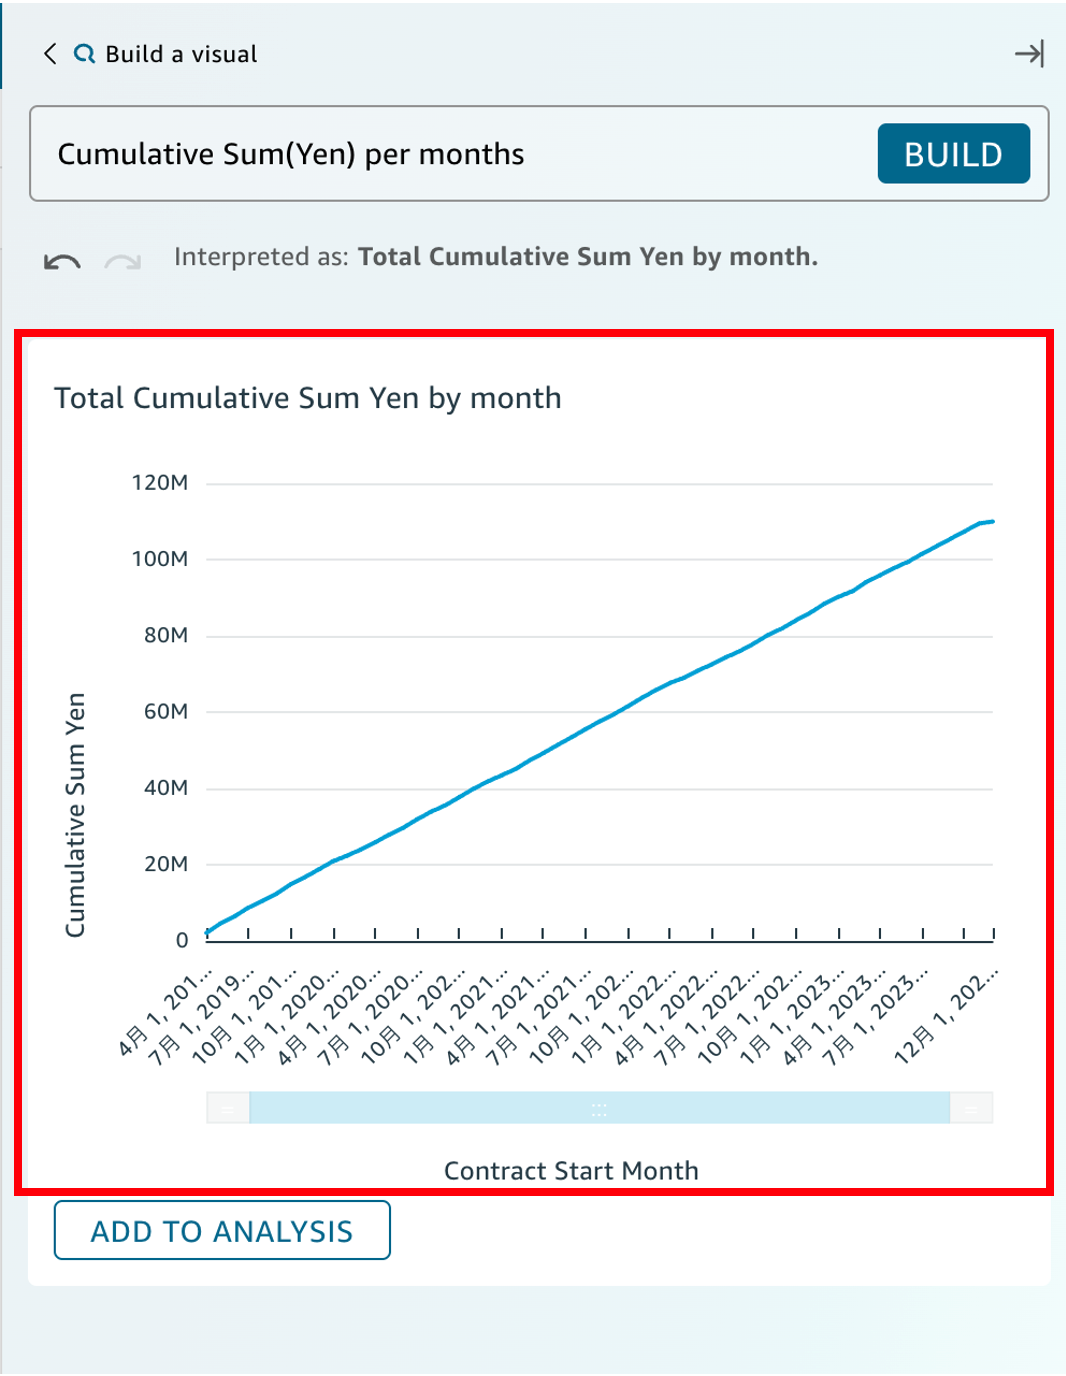
- Create a monthly sales trend graph by month and year
Similarly, enter the following prompt.
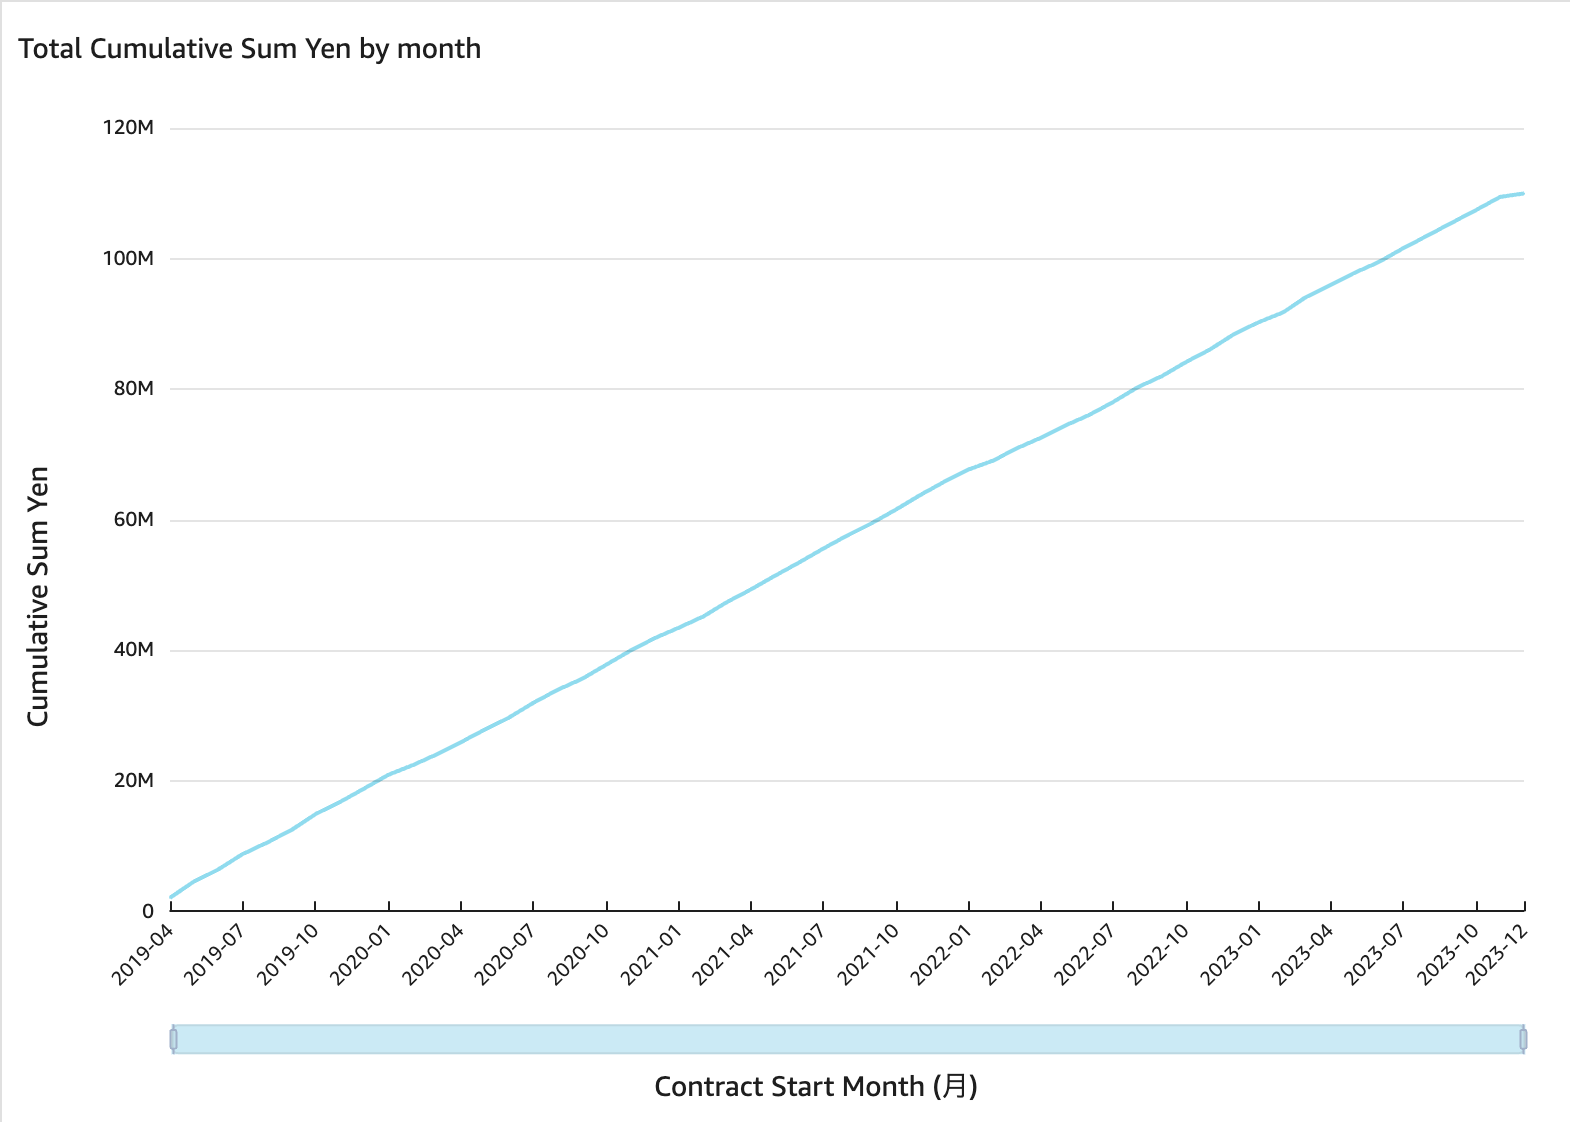
Cumulative Sum(Yen) per months
This also produced a graph that was almost as expected.
Here is the result of manually changing the size of the graph after adding the visual.
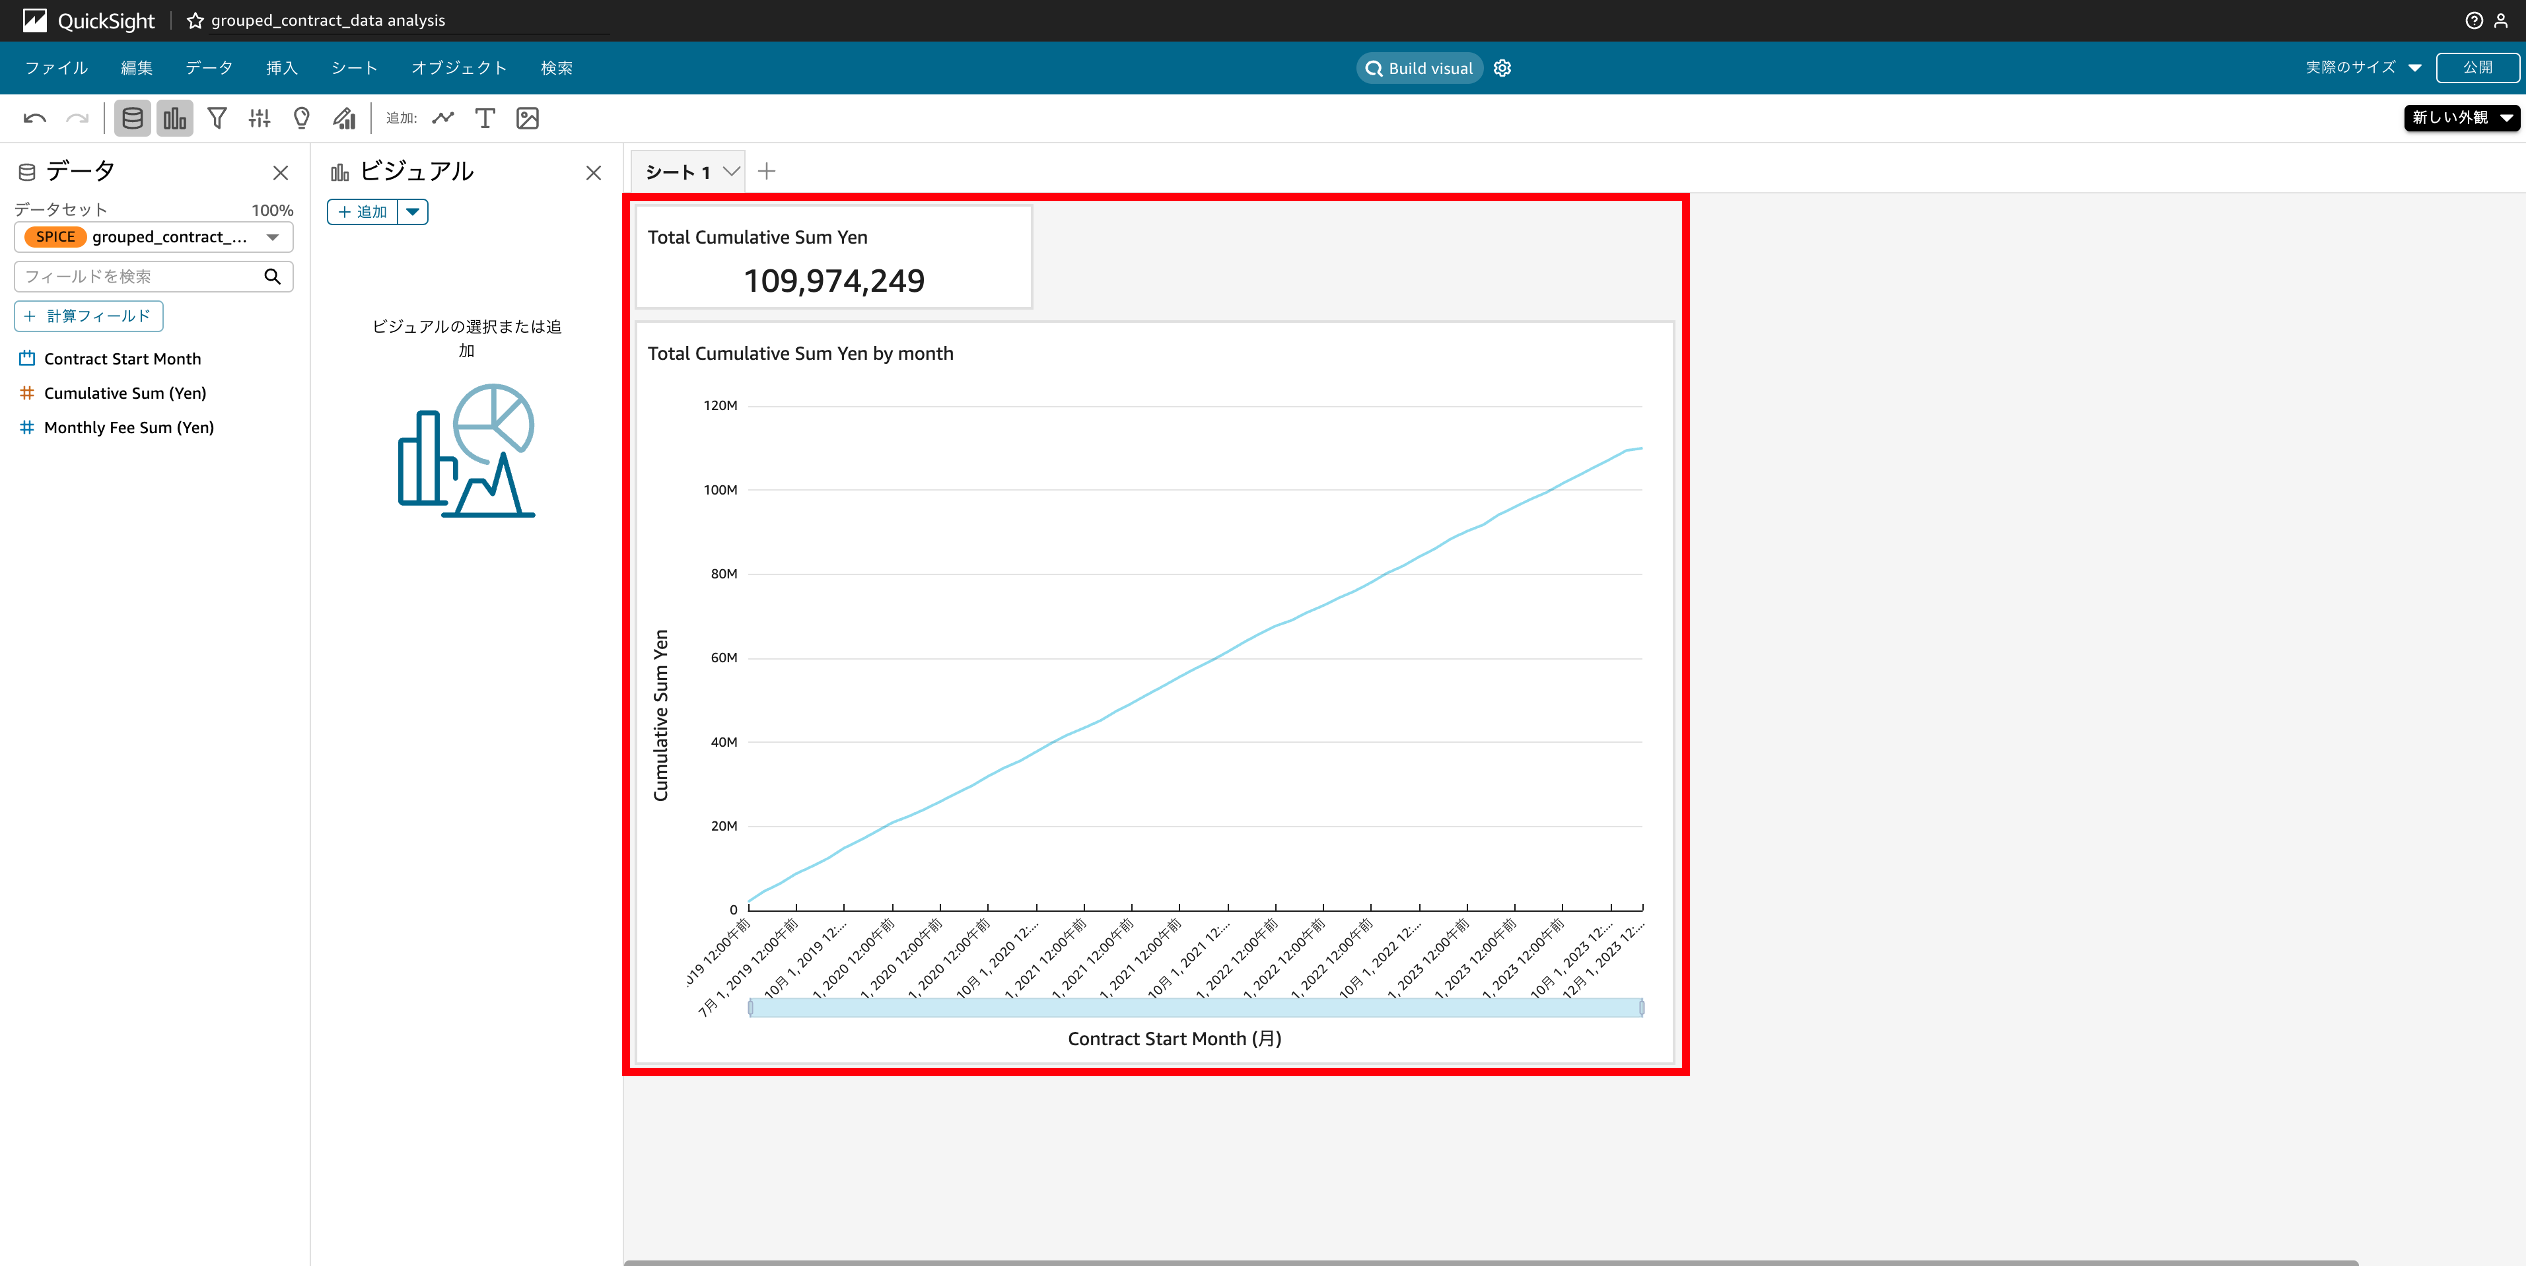
The horizontal axis is in "MMDD, YYYY HH/hh" format, which is difficult to read, so I changed the visual.
Generative BI also seems to be able to make visual changes in natural language.
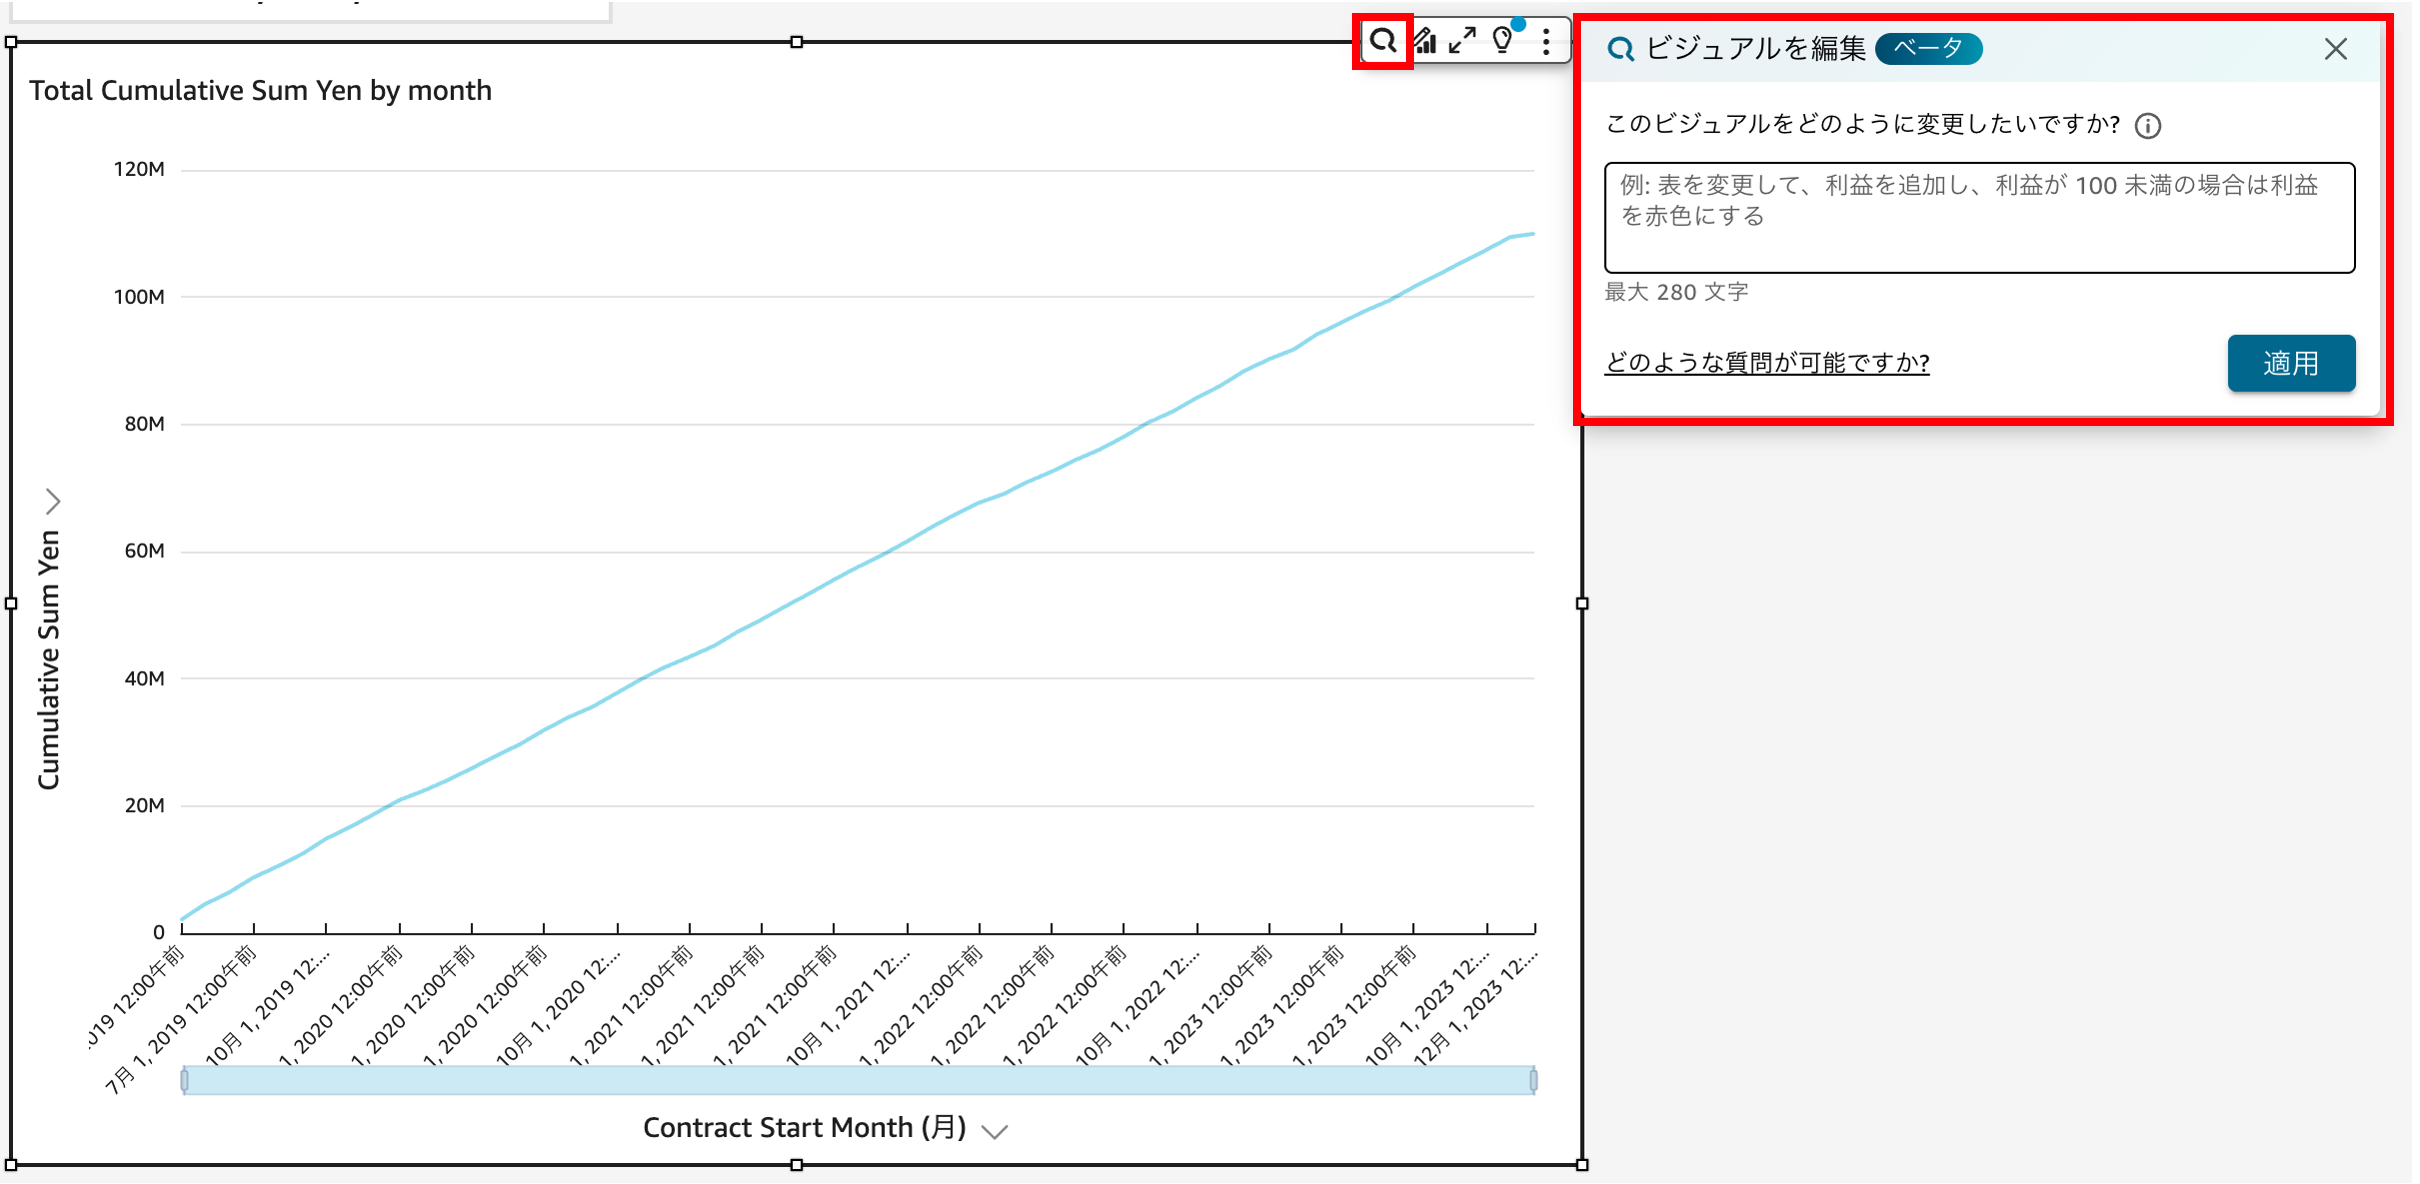
As you may have noticed, my English skills are not very strong, so I rely on our in-house AI-ChatBOT (Sherpa) for support.

I Typed in.
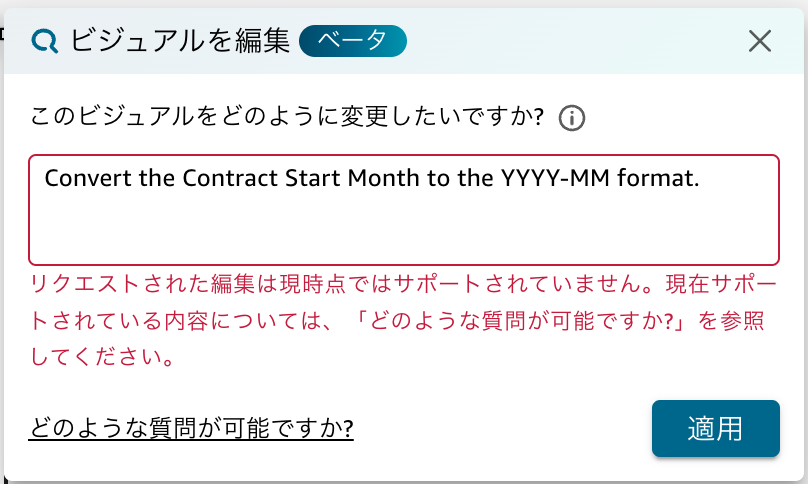 Apparently, the visual editing functionality is still insufficient.
Even if I check the official website, it seems that there aren't many things I can do yet, so I'll modify it manually.
I'm looking forward to the future.
- Create a monthly sales ranking table by prefecture
Next, I will try to output a visual in table format. Once again, with the help of Sherpa, I entered the following prompt.
Please provide the monthly fee sum yen for each prefecture in a ranking format in a table in December 2023
(Three consecutive “in”s! )
Results
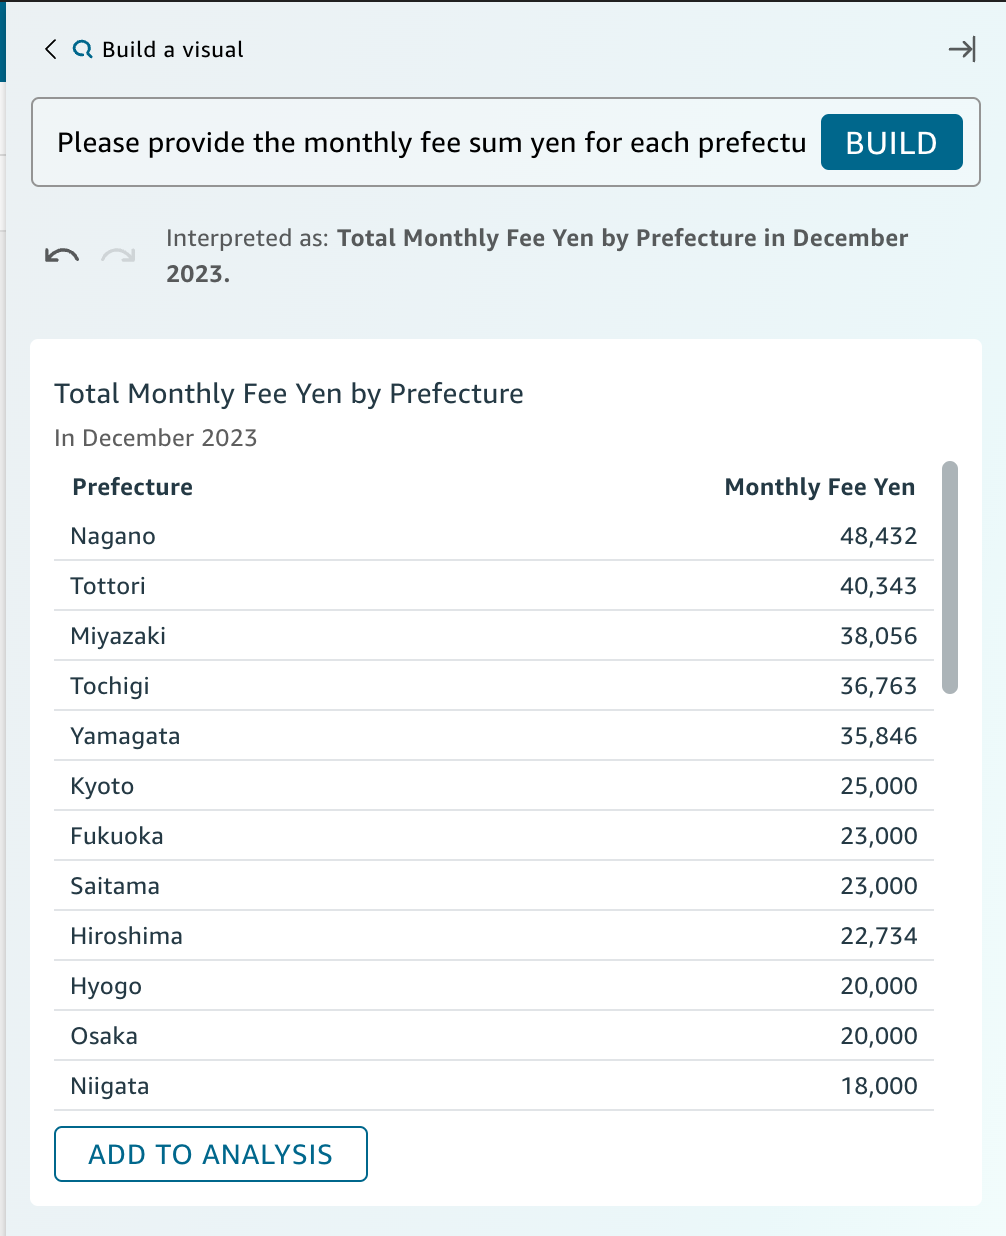 How impressive. It displayed exactly the table I wanted.
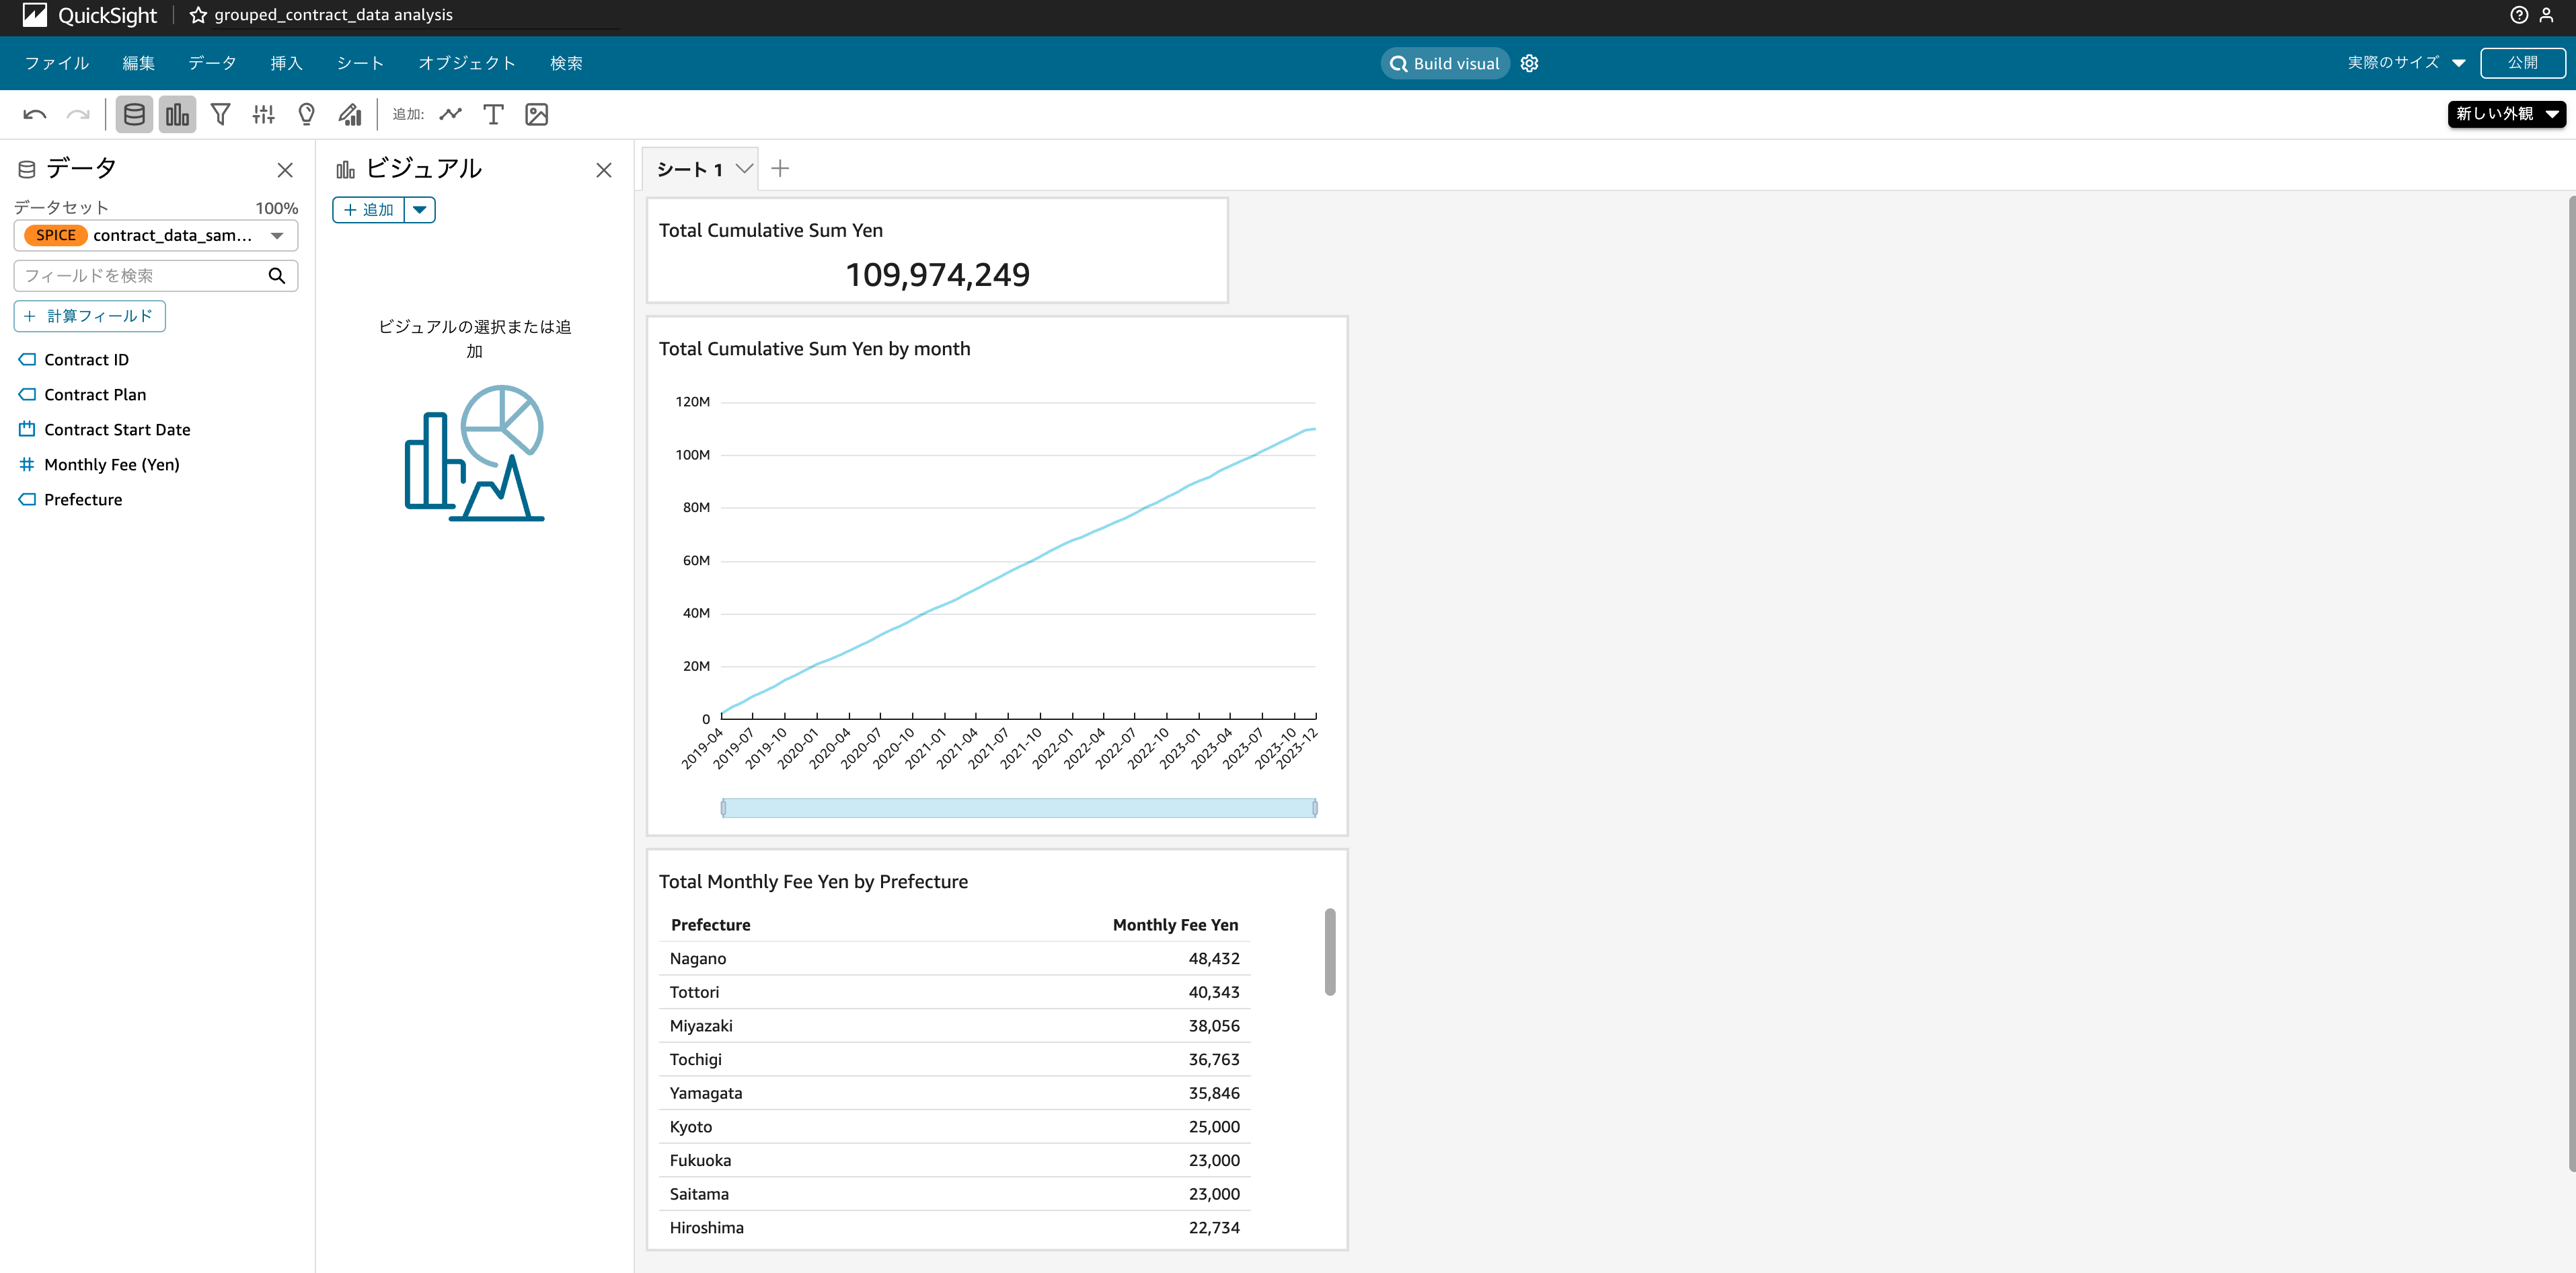
Added to the visual (graph size, etc., has been modified manually.)
2. Contract plan composition ratio
Next, I'd like to see the percentage of subscription contract plans as a pie chart.
As always, I asked Sherpa to translate and entered the following prompt.
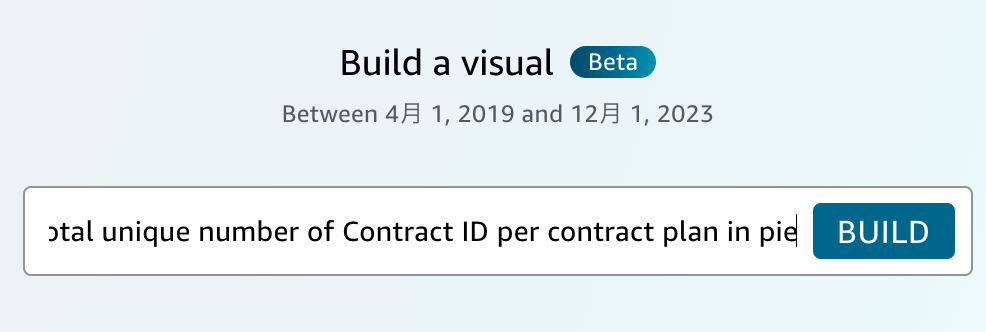
total unique number of Contract ID per contract plan in pie
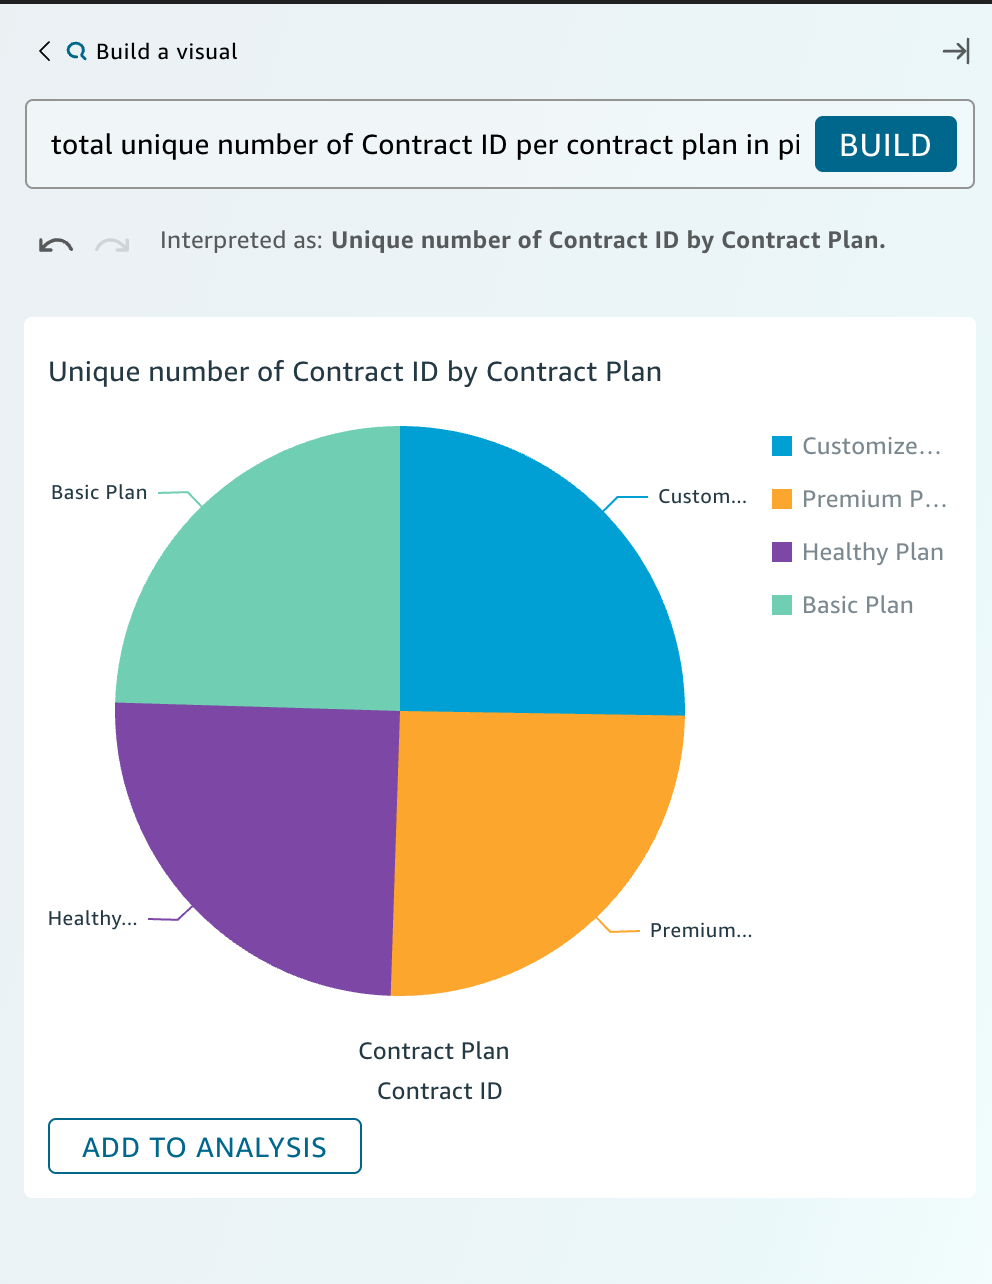
It's perfect!
I also asked to display the total monthly fee for each plan.
Total monthly fee for each contract plan in table
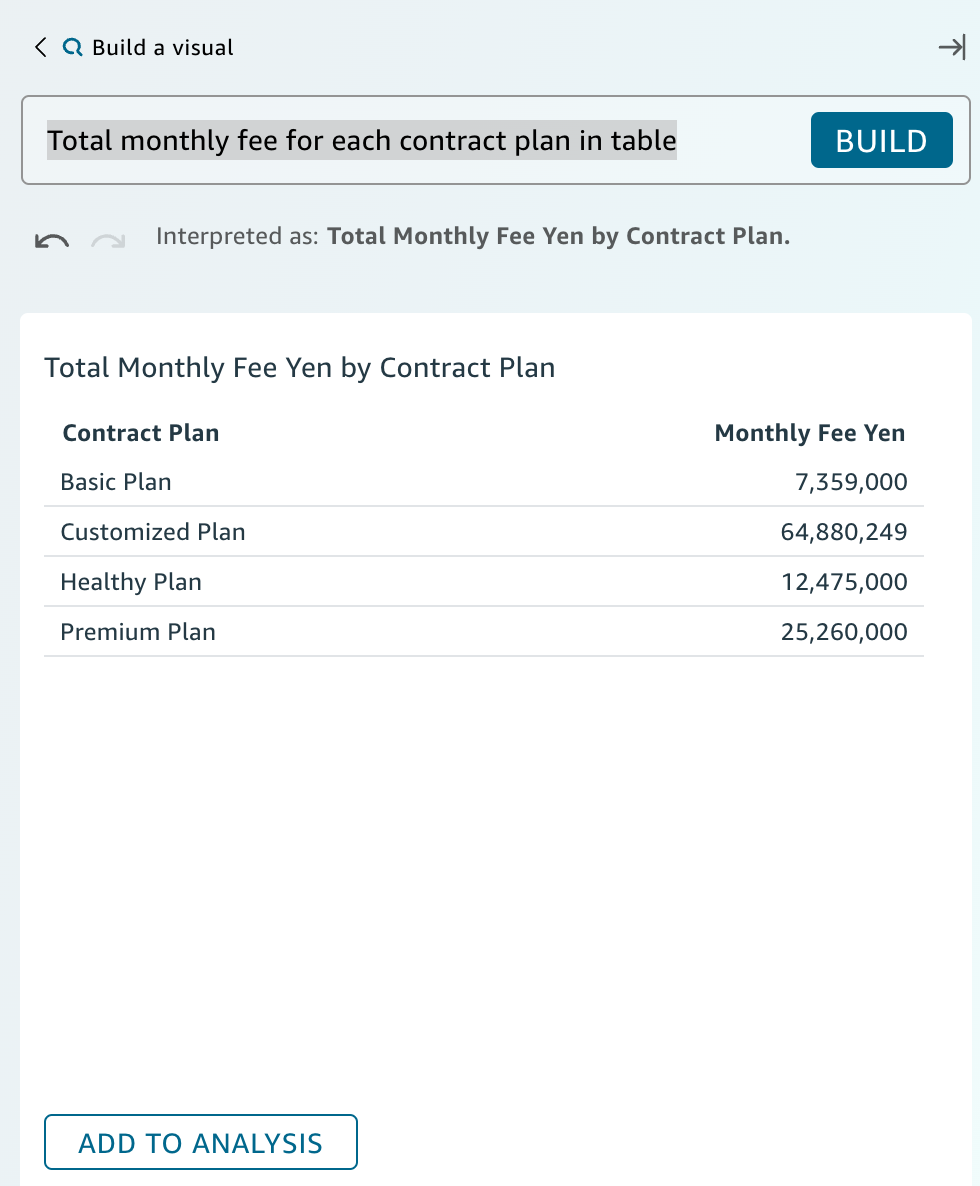
Dashboard view
Let's turn the created charts into a dashboard and check it.
Generative BI created everything, except for the chronological format of the line graph. It looks pretty good, right?

Exective summary
There seems to be a function that creates a summary based on the dashboard contents.
Click on "Executive summary" from the "Build" button in the upper right corner of the dashboard screen. 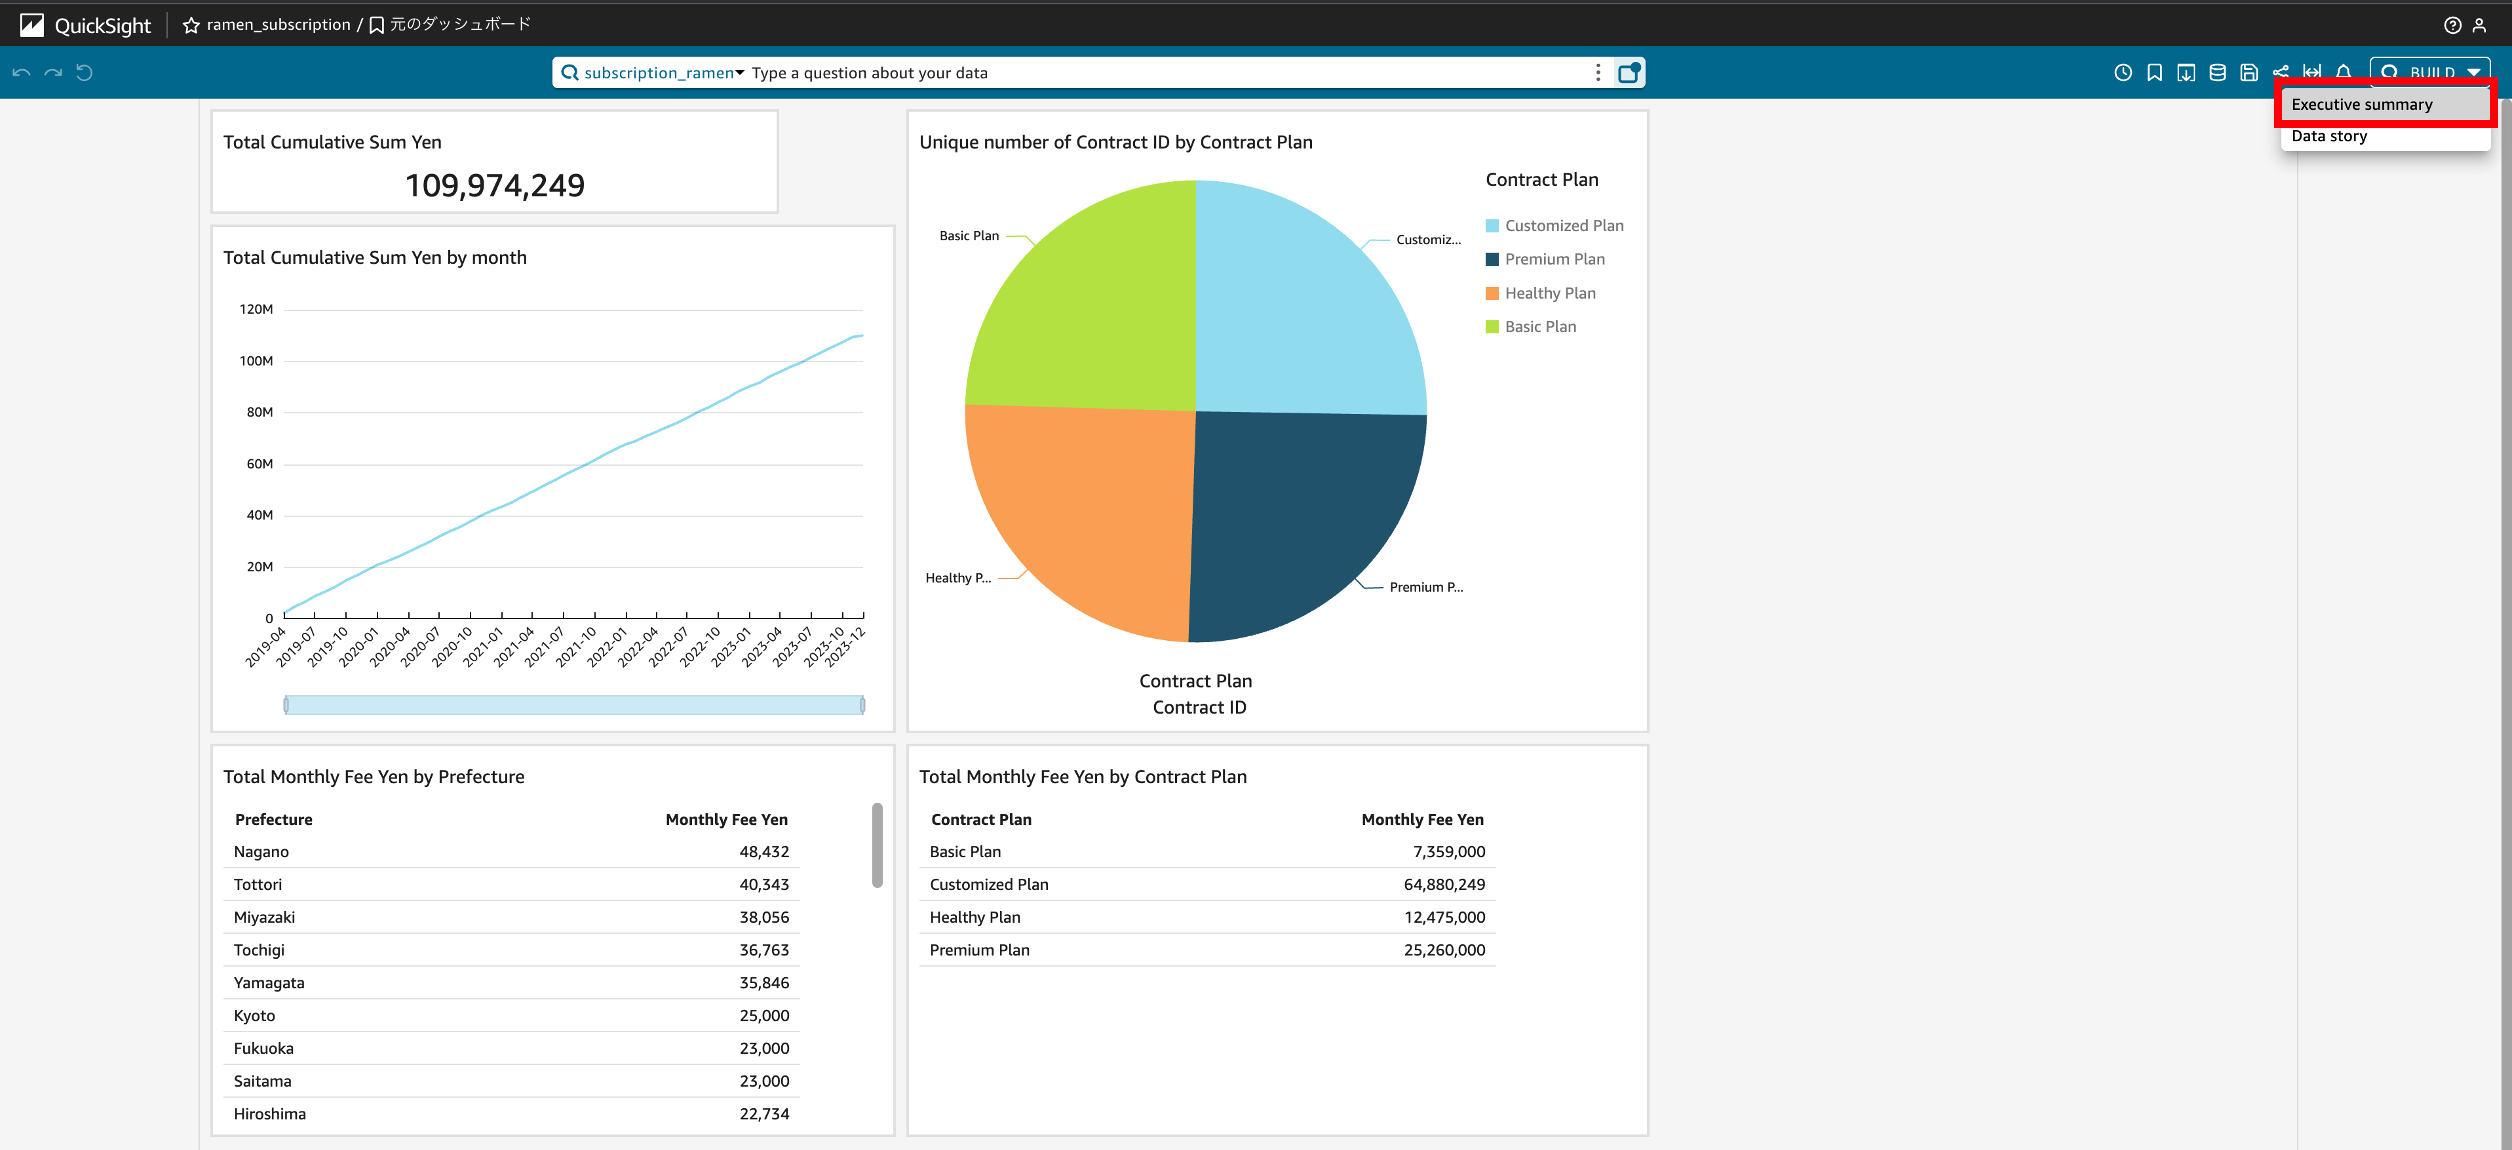
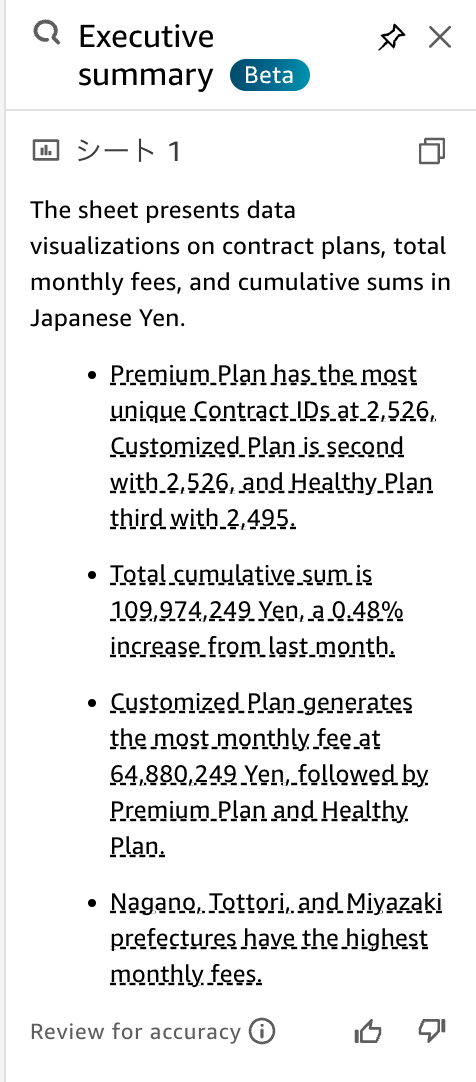
A summary was created in about 10 seconds.
The structure seems to be a description of the entire dashboard and each chart. Although it is very simple, the content appears to be accurate. Moreover, a link was embedded in the description of each graph. For large dashboards, clicking on the summary jumps to the linked graph, which is convenient.
Good Points and Future Improvements
Good points
- It creates charts instantly by giving natural language commands.
For simple graphs, it is faster than making them manually. - It will guess the column name to some extent even if you do not explicitly specify it. → Conversely, it is necessary to name the appropriate columns to be guessed.
- Monthly totals are also done automatically.
- The Executive Summary can be used as a basis for the material.
Future Improvements
- The fine-tuning function of graphs is still insufficient. It would be faster to do this by hand than by natural language.
- English only. (As of December 11, 2023)
- The input field is short, making it difficult to correct sentences. After entering a long sentence, it was a little difficult to edit the sentence when the graph I wanted was not displayed.
- It does not understand chronological expressions such as last 3 months.
Conclusion
This time, I tried the public preview version of Generative BI.
Although it is not at the level of practical business use yet, I think the service shows a lot of promise depending on future updates.
If we can easily and quickly visualize the current situation, we will be able to accelerate the cycle of business improvement, so I look forward to the future.
(This is a bit off-topic, but I was very surprised by the high degree of completion in the sample data and illustrations created by ChatGPT.)
Furthermore, there is an article about the Analysis Group provided on the Tech Blog below, so please read it if you are interested.
A Look into the KINTO Technologies Analysis Group
関連記事 | Related Posts

Generative AI and Copilot — How a Non-Engineer like Me Developed an Operation Tool Using AI

Sharing How Great Was Our Group Reading Session 'Learning from GitLab: How to Create the World's Most Advanced Remote Organization'.

8月・9月入社メンバー紹介②

Meet Our New Team Members: May 2024 Update
SageMakerを使った学習&推論のバッチパターン (2/4)

Participation Report of the 28th Shirahama Symposium on Cybercrime
We are hiring!
【データサイエンティスト】データサイエンスG/東京・名古屋
データ分析部について※データ分析部は、データサイエンスGが所属している部門です。クルマのサブスクというビジネスモデルを展開するKINTOでは、市場やお客様のニーズを捉え、最高の顧客体験を提供するために、マーケティング分析においても挑戦と創造が求められます。
【データサイエンティスト(リーダークラス)】データサイエンスG/東京・名古屋
データ分析部について※データ分析部は、データサイエンスGが所属している部門です。クルマのサブスクというビジネスモデルを展開するKINTOでは、市場やお客様のニーズを捉え、最高の顧客体験を提供するために、マーケティング分析においても挑戦と創造が求められます。

