約11分で読めます
SRE
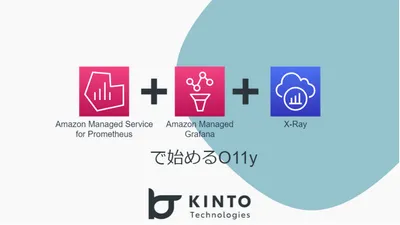
Prometheus + Grafana + X-Rayで始めるO11y
はじめに
こんにちは。プラットフォームGでDevOpsエンジニアをしている島村です。
KINTOテクノロジーズのプラットフォームGのDevOpsサポートチーム(とSREチーム)では、CI/CD以外にも、監視ツールの整備やモニタリングツールの改善を実施しています。
プラットフォームGは他にもSystemAdministratorチーム、CCOE、DBREなどがあり、AWSを中心としたインフラの設計・構築運用の他にも会社全体のシステム改善や標準化・最適化を担っています。
その中で、昨年にGAとなったAmazon Managed Service for Prometheus(以降Prometheus)とAmazon Managed Grafana(以降Grafana)とX-Rayを使用したAPMの仕組みを導入しましたので、そのことを記事にしようと思います。
背景
私が入社した2021年5月時点でKINTOテクノロジーズ(当時はKINTO)では、AWSリソース監視・ログ文言の監視を行っていました。ただし、CloudWatchを使用したもので、プラットフォームGが設計・設定を行っていました。
当時はアプリケーション運用としてのメトリクスなどは取得されていませんでした。ログ監視も設定の柔軟性は低く、エラー検知はAWSのメトリクスもしくはログによるものか、外形監視からの通知による受動的な検知と対応が主でした。
よく言われるようなO11yの成熟度からすると「Lv0:計測を始める」もできていない状態です。ただ、プラットフォームG内部では問題と認識していたので、まずは計測を始めようということで、APM+X-Rayを導入することとしました。
O11yの成熟度モデルとかの参考はこちら
要素
APM(Application Performance Management)
アプリケーションやシステムの性能を管理・監視すること。アプリケーションパフォーマンス管理とも言い換えられます。アプリケーションやシステムの応答時間や構成要素のパフォーマンスを調査することで、アプリケーション全体の稼働状況を把握し、ボトルネックやシステム障害の要素を素早く把握し、改善に役立てるために使用します。
X-Ray
AWSで提供している分散トレーシングの仕組みです。
- システム全体におけるサービス間の呼出関係の可視化
- 特定リクエストにおけるサービス間の呼出関係の可視化 (特定リクエストの処理経路の可視化)
- システム全体のボトルネックを迅速に特定する
上記のことが可能となります。
タスク(Action)
検討する
まずは「Lv0:計測を始める」を満たすことを考えました。実装時には、「Prometheus+Grafana」という前提が提示されており、ちょうどAWSでマネージドサービスとしてプレビューされていたタイミングだったので、そちらを選択しました。
Datadog / Splunk / NewRelic / DynaTraceなど、一般的によく使われているSaaSもありますが、前提条件から検討せずにAWSを使用することとしました。あとから、ここらへんのSaaSを使わなかった理由も分かってきました。その理由だと思うことは後述で。
実装する
Prometheus
Prometheusへのメトリクス出力については
Amazon Managed Service for PrometheusにECSからアプリケーションメトリクスを収集する
としてまとめています。2021のKINTO Technologiesのアドベントカレンダーとして作成した記事です。
X-Ray
検討当時のメンバーの資料を引継ぎしまして、AWS X-Ray SDK for Javaをベースとして、ECSタスク定義への取り込みなどを整理し、資料化を行いました。
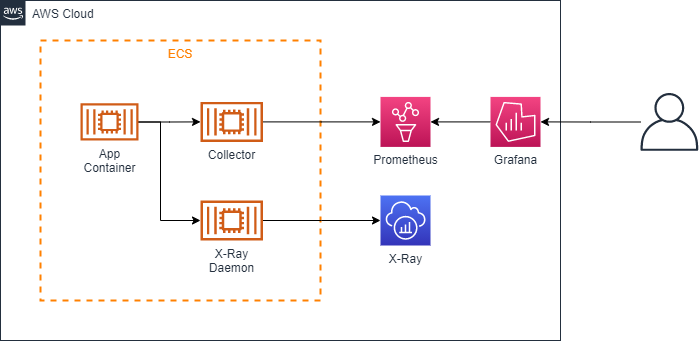
初期構成
改善する
X-Ray SDKのOpenTelemetry化
Java17を使い始めたチームから、X-RayのServiceMapがうまく表示されないという相談がありました。よくよく見ると、AWS X-Ray SDK for JavaはJava8/11には対応を明言していますが、Java17への対応は明言されていません。今はAWSDistro for OpenTelemetry Javaが推奨されているようなので、全体的にこちらに切り替えることにしました。APMのCollectorと同居できることも良いことの1つです。
Java
aws-observability/aws-otel-java-instrumentationから最新のReleaseのjarファイルをダウンロードし、src/main/jib以下に保存するだけで導入ができます。SDK for Javaではサンプリング設定の定義ファイルなどもありましたので、導入が簡素になっている印象です。
ECSタスク定義の環境変数
JAVA_TOOL_OPTIONSにAgentの定義を追加します。OTELの環境変数も追加しています。ECSのタスク定義のjsonを確認すると
{
  "name": "JAVA_TOOL_OPTIONS",
  "value": "-Xms1024m -Xmx1024m -XX:MaxMetaspaceSize=128m -XX:MetaspaceSize=128m -Xss512k -javaagent:/aws-opentelemetry-agent.jar ~~~~~~"
},
{
  "name": "OTEL_IMR_EXPORT_INTERVAL",
  "value": "10000"
},
{
  "name": "OTEL_EXPORTER_OTLP_ENDPOINT",
  "value": "http://localhost:4317"
},
{
  "name": "OTEL_SERVICE_NAME",
  "value": "sample-traces"
}
のような形になります。(実際はParameter Storeなどを使うのでちょっと変わりますが)
OpenTelemetryColletorのConfig
Configurationを参考にしつつ、以下のような形でCollectorのConfigを修正します。
APMとX-Ray両方が入っているかつ、タスクごとにメトリクスにラベルがついている形です。
exporterとして使用している「awsprometheusremotewrite」はAWS-OTEL-COLLECTORのv0.18から非推奨に、v0.21からは機能が除かれており、「PrometheusRemoteWrite」+「Sigv4Auth」を使用するようになってますので、ご注意ください。
receivers:
  otlp:
    protocols:
      grpc:
        endpoint: 0.0.0.0:4317
      http:
        endpoint: 0.0.0.0:4318
  awsxray:
    endpoint: 0.0.0.0:2000
    transport: udp
  prometheus:
    config:
      global:
        scrape_interval: 30s
        scrape_timeout: 20s
      scrape_configs:
      - job_name: "ktc-app-sample"
        metrics_path: "/actuator/prometheus"
        static_configs:
        - targets: [ 0.0.0.0:8081 ]
  awsecscontainermetrics:
    collection_interval: 30s

processors:
  batch/traces:
    timeout: 1s
    send_batch_size: 50
  resourcedetection:
    detectors:
      - env
      - ecs
    attributes:
      - cloud.region
      - aws.ecs.task.arn
      - aws.ecs.task.family
      - aws.ecs.task.revision
      - aws.ecs.launchtype
  filter:
    metrics:
      include:
        match_type: strict
        metric_names:
          - ecs.task.memory.utilized
          - ecs.task.memory.reserved
          - ecs.task.cpu.utilized
          - ecs.task.cpu.reserved
          - ecs.task.network.rate.rx
          - ecs.task.network.rate.tx
          - ecs.task.storage.read_bytes
          - ecs.task.storage.write_bytes

exporters:
  awsxray:
  awsprometheusremotewrite:
    endpoint: [apm endpoint]
    aws_auth:
      region: "us-west-2"
      service: "aps"
    resource_to_telemetry_conversion:
      enabled: true
  logging:
    loglevel: warn
extensions:
  health_check:

service:
  telemetry:
    logs:
      level: info
  extensions: [health_check]
  pipelines:
    traces:
      receivers: [otlp,awsxray]
      processors: [batch/traces]
      exporters: [awsxray]
    metrics:
      receivers: [prometheus]
      processors: [resourcedetection]
      exporters: [logging, awsprometheusremotewrite]
    metrics/ecs:
      receivers: [awsecscontainermetrics]
      processors: [filter]
      exporters: [logging, awsprometheusremotewrite]
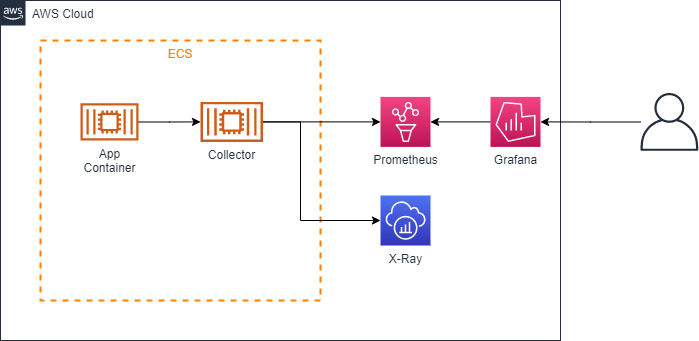
現行構成
使ってもらう
特に難儀した点です。
「はじめに」に記載した通り、私はプラットフォームGの所属で、ツールを検討して提供しています。いびつな形ではありますが、DevOpsとしてツールなどを全体最適としたかったので、全社横断(横串)で活動するプラットフォームGに所属しています。そのため、
- (問題と思っている)プラットフォームG
- (そこまで問題と認識していない)アプリケーション担当
という状態に陥りました。最近は地道な活動を通じて、必要性を理解をしてもらえて来ていると思います。
SaaSを使わなかった話
ここは個人的な考えです。
特にO11y関連のSaaSってデータ量も多く、総じてお値段がお高くなるイメージがあります。上記の必要性を理解してもらうまで、「使わない」ツールに対して多額の費用を払うというのは、やはり費用対効果を考えると難しいところです。
O11yの成熟度Lv2の積極的対応くらいまで進むと、俯瞰的にボトルネックやパフォーマンスを見たいという要望が出てきて、そこで使用する価値が生まれてくるのではないかと思います。ログやメトリクスとイベントと紐づけたりなど。受動的な対応までなら、ツールが分割されていても、各人のタスク負荷的や量としては許容されるのかなと思っています。
一時的にGrafanaダッシュボートおじさんができるのは仕方がない。ダッシュボートおじさんのコストよりも、SaaSのコストが低くなれば移行していく…はず。
所感
GrafanaもPrometheusもX-Rayも、マネージドサービスであり導入はSaaSほどは簡単ではありませんが、コストという意味では比較的安価で導入できるものです。DevOpsやSRE活動の初期として、O11yを導入するにあたっては、検討する価値はあるのではないでしょうか。
SaaSを使わなかった話にもありましたが、使い始めてからO11yの価値を見て、改善や活動を見直し、コストを比較してから各種SaaSを使い始めるということでも、良い気はしています。
いや、DatadogとかNewRelicのダッシュボードとかHostMapとか、画面上は綺麗に見えますしなんか動いてて監視・モニタリングしている実感を感じますし、見栄えが良いから(`・ω・´)イインジャネ!!と考えるのは、よくわかります。カッコイイもの…