Training and Prediction as Batch Pattern (2/4)
By Ikki Ikazaki, MLOps/Data Engineer in Analysis Group
This is the second part in a multi-part series on how KINTO Technologies Corporation(KTC) developed a system and culture of Machine Learning Operations(MLOps). The first part was How We Define MLOps in KTC. The two subsequent posts will be about SageMaker Experiments to track the experiments conducted by data scientists, and "Benkyo-kai", a series of internal study sessions, to form the common knowledge about SageMaker and MLOps with other departments.
Situation
In this post, we are focusing on batch implementation of ML training and serving process using SageMaker Pipelines. We will refer to "Batch training pattern" and "Batch pattern" as defined by Mercari, inc. Before getting into details of the technical explanation, let us introduce an analysis backgroud briefly about demand forecast for our service: KINTO ONE. KINTO ONE is an all-inclusive lease solution that gives you all the benefits of driving a new vehicle with a transparent monthly fee. Our Marketing & Planning Department and Analysis Group tries to understand the customer demand for KINTO ONE in Japan and check the dashboard weekly where they can see all the important figures and KPIs. Those numbers or its analytical data are generated by subsequent data and ML pipelines' regular processing, and thus it is important to organize the whole relevant systems of the dashboard to securely monitor and operate.

↑ TOYOTA car lineup KINTO ONE offers(As of July 2022)
Task
As described above, we need to implement the system so that we can check the latest information, but the question is how often the data should be updated. Launching a serving endpoint for real time prediction incurs unnecessary cost even when we don't need it while updating the prediction result less frequently causes the stale data and even misunderstanding among the business analysts. In our case, they are supposed to check the dashboard weekly and sometimes look up the specific values or KPIs once they come up with some analytical hypotheses. Therefore, it would be enough to update the dashboard daily and that they can check the values based on the data of the previous day. Then, batch system which is triggered by time-based schedule of cron syntax seems good for our use case. Also, since we have the software program of KINTO ONE on top of AWS, it becomes easier to build the ML pipeline using AWS managed service.
Action
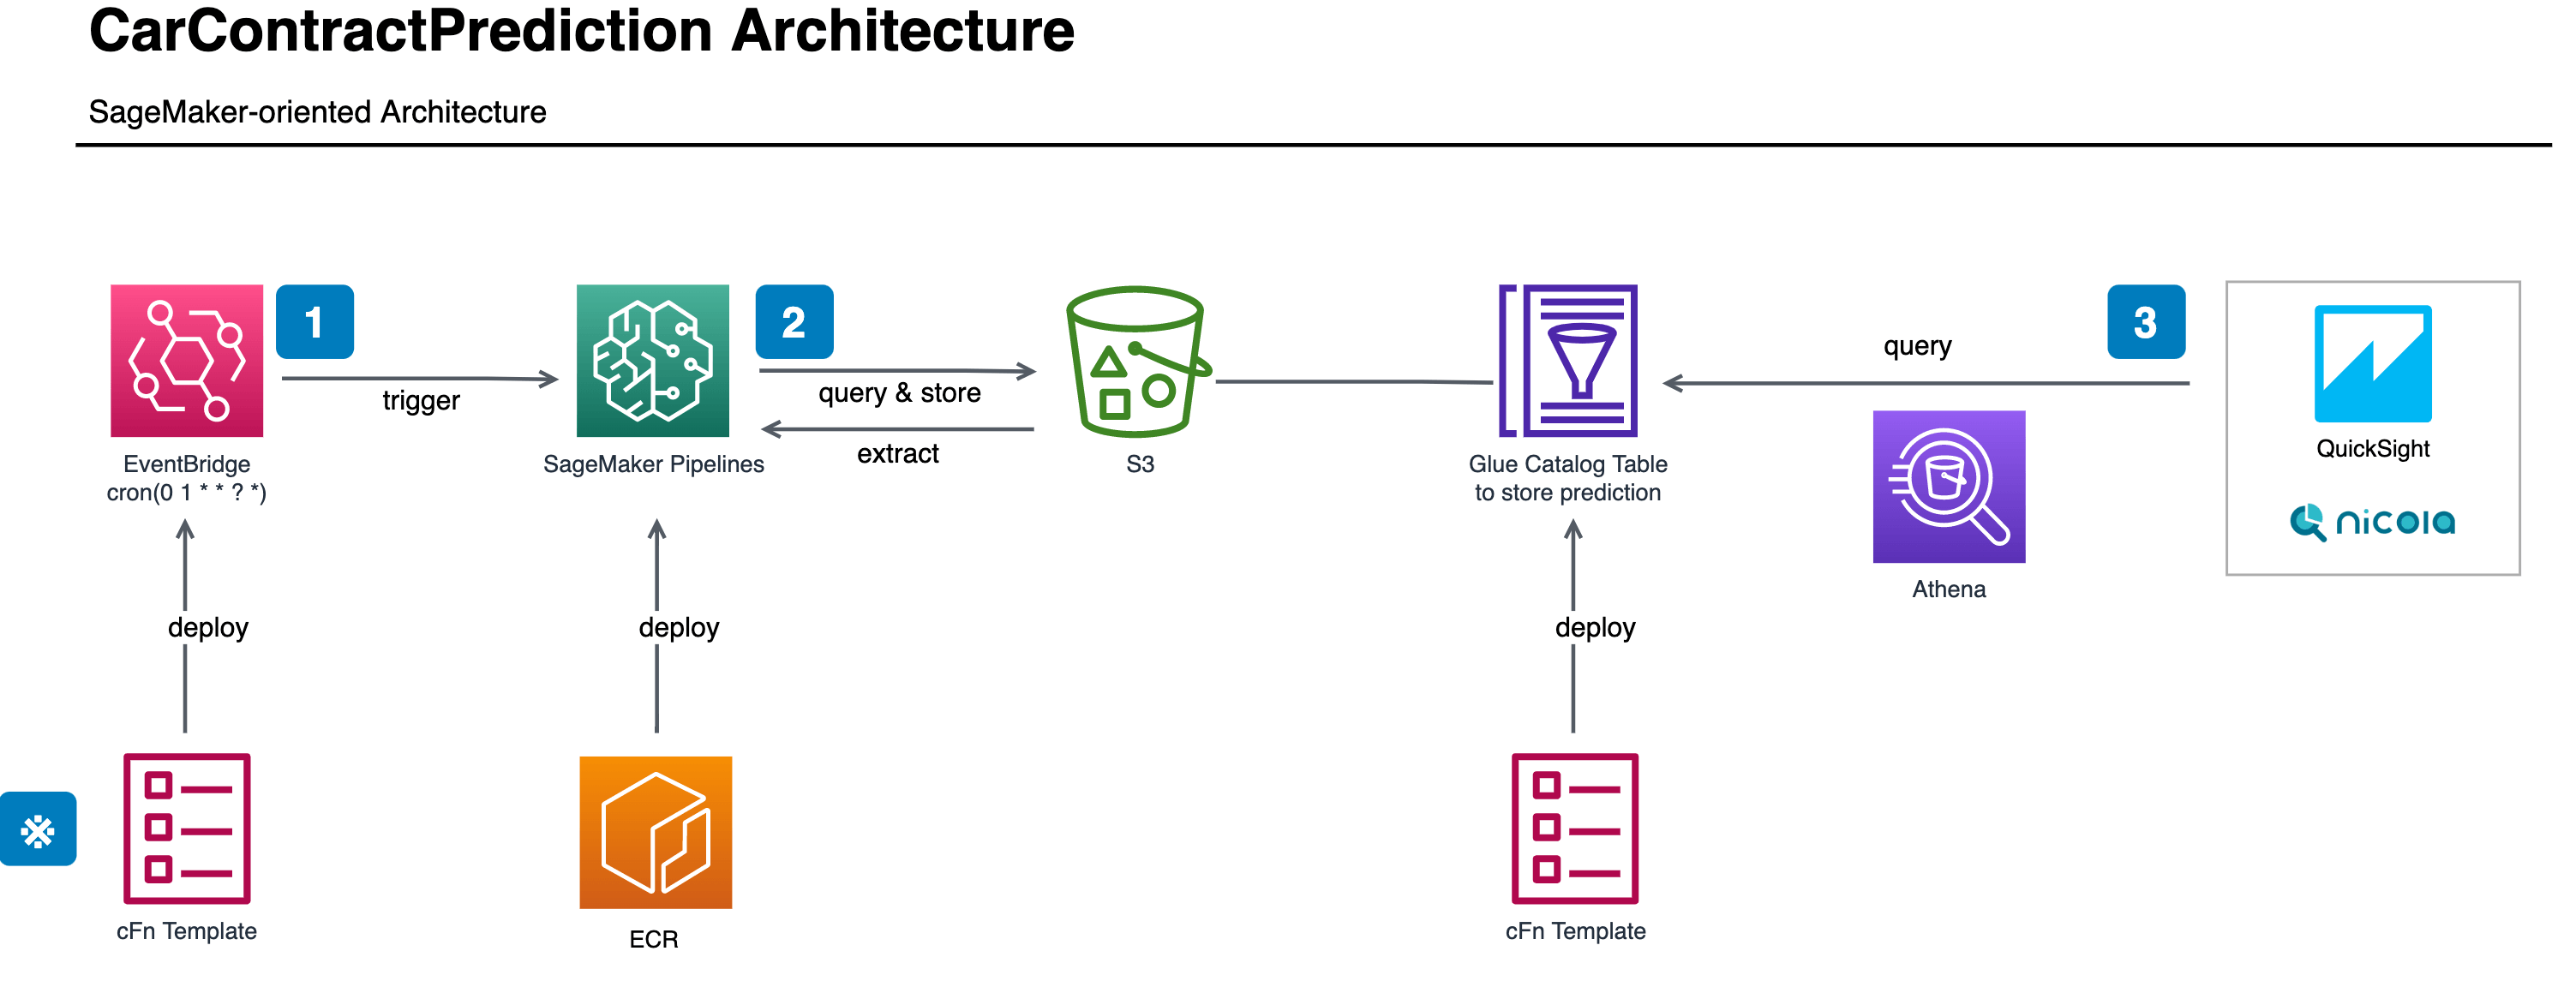
The whole architecture of ML pipeline is depicted as below.

SageMaker Pipelines
SageMaker is a managed IDE for ML developers and provides us the capability to design, develop, and operate the whole ML-related processes. To implement batch pattern for our usecase, one of its features, SageMaker Pipelines, is the best fit solution. You can implement the ML pipeline with it by combining each pipeline's step which is in turn built as SageMaker Processing, the managed data processing component of SageMaker. Through configuring the pipeline's definition, you can also visualize it in the format of Directed Acyclic Graph(DAG) like below.
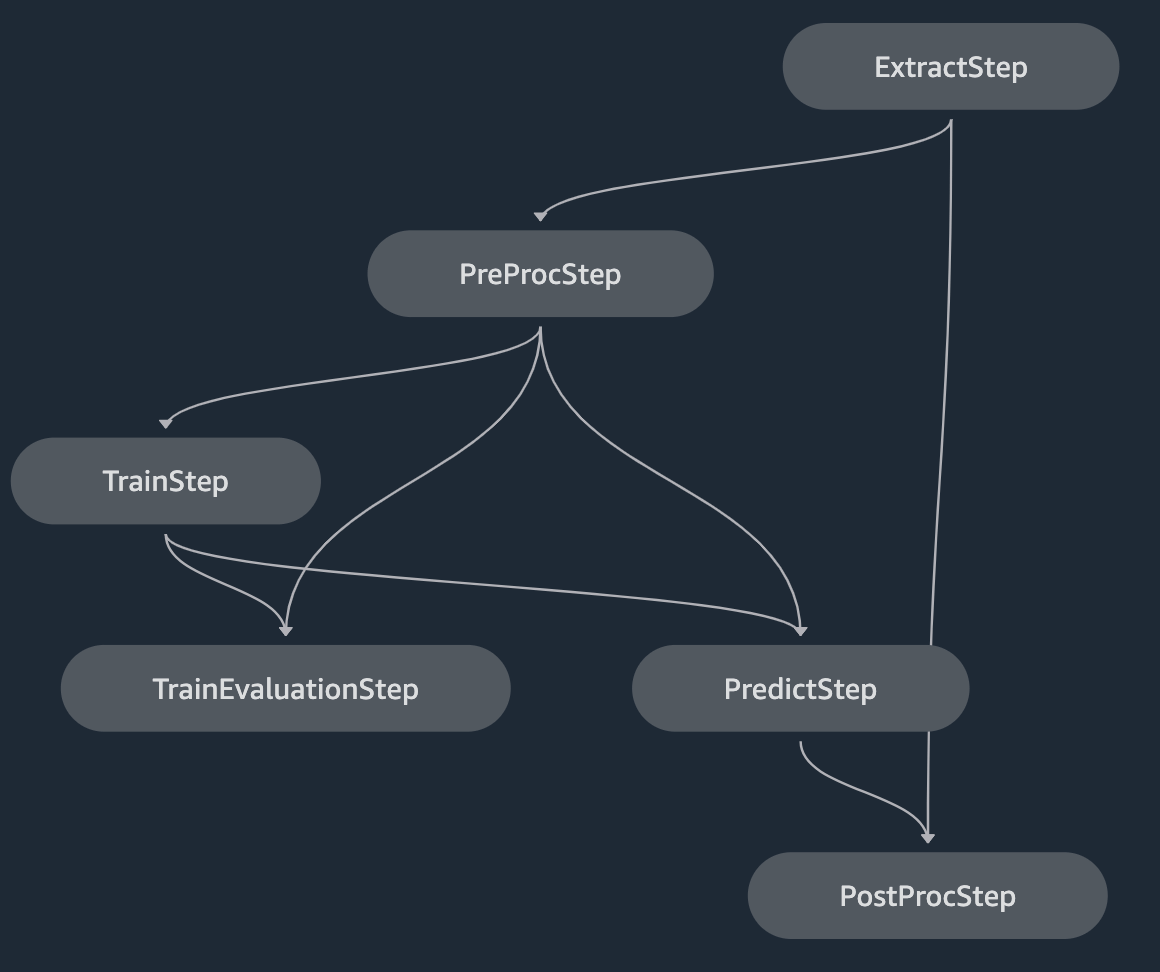
The following is the brief description about each step.
| Step Name | Brief Description |
|---|---|
| Extract | Data extraction step using AWS Athena to query. |
| PreProc | Data preprocess step for time series analysis. |
| Train | Model building step using the dedicate SageMaker SDK. |
| TrainEvaluation | Evaluation step about whether the model performance and objective metrics meet the criteria. |
| Predict | Prediction step using the trained model and future data to be predicted. |
| PostProc | Data postprocess step for the integration with data platform. |
You can flexibly design the pipeline like above with your imagination and the important thing here is that you can execute the pipeline as a batch process. Because SageMaker Pipelines is natively integrated with Amazon EventBridge, you can initiate SageMaker Pipelines when the schedule of cron expression triggers the EventBridge.
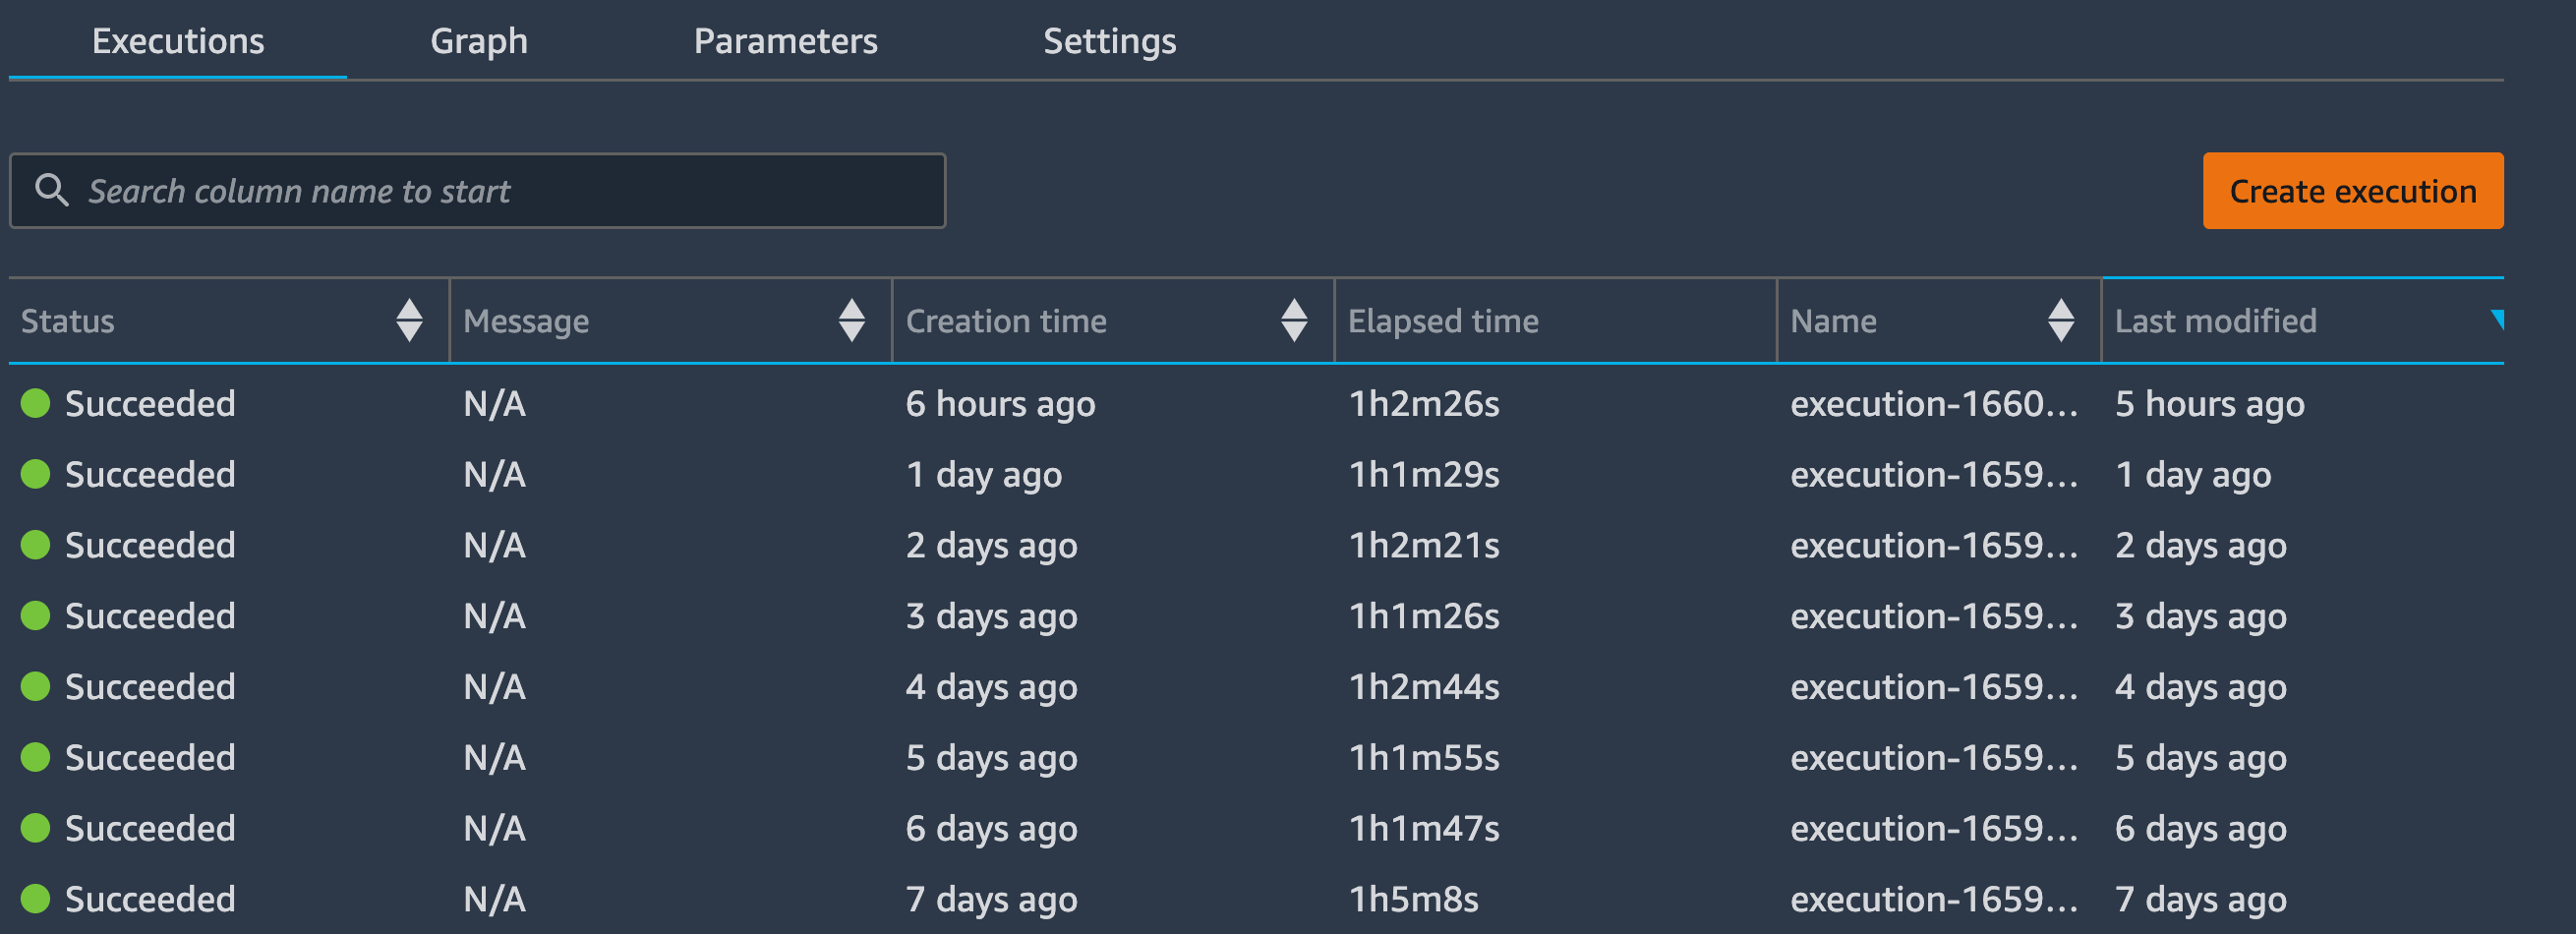
EventBridge can also be used for monitoring. It is important to track whether the daily pipeline was executed successfully or not to ensure the latest dashboards. The execution status of SageMaker Pipelines including each step's status is transmitted to CloudWatch and EventBus without any settings and EventBridge can target SNS Topic to notify the execution status in real time. And while the pipeline is stable most of the time, we do have a Slack channel to monitor the daily status execution in order to handle the issues as soon as the pipeline execution fails.
QuickSight
At the last step of the above pipeline, the prediction result is registered into Glue Catalog Table so that it can be queried through Athena. Specifically speaking, it adds the daily partition for the prediction result — which brings you another benefit by making the pipeline idempotent that you can just re-run the failed execution to fix the bug. From the consumer perspective, it becomes easier and cheaper to extract the prediction result as it is partitioned and the consumer just specify the data range they need.
QuickSight, a managed BI dashboard AWS offers, also extracts data through Athena and displays the dashboards by aggregating the prediction results. Actually, "Athena type" of QuickSight's Datasets can import the queried data to SPICE, its in-memory calculation engine, based on the schedule you set so that the dashboards reflect the latest information. The only trick in the entire system is just to orchestrate the schedules of ML pipeline and dashboard's refresh timing. Since it takes time to finish the ML pipeline execution, we need a buffer time before the dashboard refreshes. One thing we were not expecting is that SageMaker Pipelines take 5-10 minutes to initiate a computing instance at each step. As illustrated above, there are 5 steps in serial, so all in all the pipeline initialization takes almost an hour to finish. Fortunately, there were no fast refresh requirements this time and the extra an hour doesn't cause serious problem for the entire system.
Result
The orchestration of SageMaker Pipelines and QuickSight can be seen as one of batch implementation of prediction system. The benefit by applying a batch system rather than having endpoints for real-time prediction is to make the operation easy to manage — please also visit my previous post where I described that one of main goals of MLOps is "PJ Management With Speed". Imagine if you deploy a new version on prediction endpoint, you need another deployment system such as Kubernetes Deployment to not cause or reduce downtime. On the other hand, if you implemented an idempotent batch system, the desired outcome can be obtained just by re-running it even if you failed the deployment or found any bugs on the new version.
Also, operating the batch pattern prediction costs relatively less compared to having the endpoints simply because batch pattern costs only pay-as-you-go. The cheaper you develop and operate, the higher the chances to increase your return on investment(ROI).
In addition, it enables you to assign a dedicated role to each technical component such that ML engineers look after SageMaker Pipelines while BI engineers take care of QuickSight's dashboards, which leads you to a more smoother operation and collaboration. BI engineers always pay attention to dashboards and their values, and notice some abnormalities once the displayed values show anomalies. It may take some time to fix the bug on the ML pipeline side, but BI engineers can handle the issues by themselves by, for example, using the past queried data to compensate the null data or simply not showing the dashboards.
This post introduced about batch pattern prediction using SageMaker Pipelines, but there's still a lot more to talk about. MLOps is a huge topic! Next time, we will explain about how we track the model performance of the pipeline every day as metadata management. Follow KTC Tech Blog for future posts to stay up to date. Part 3 is available from here.
Reference
Shibui, Y., Byeon, S., Seo, J., & Jin, D. (2020). ml-system-design-pattern[GitHub Pages]. Retrieved from https://mercari.github.io/ml-system-design-pattern/
関連記事 | Related Posts
We are hiring!
【データエンジニア】分析G/東京・名古屋・大阪
分析グループについてKINTOにおいて開発系部門発足時から設置されているチームであり、それほど経営としても注力しているポジションです。決まっていること、分かっていることの方が少ないぐらいですので、常に「なぜ」を考えながら、未知を楽しめるメンバーが集まっております。
【データサイエンティスト(リーダークラス)】分析G/東京・名古屋
分析グループについてKINTOにおいて開発系部門発足時から設置されているチームであり、それほど経営としても注力しているポジションです。決まっていること、分かっていることの方が少ないぐらいですので、常に「なぜ」を考えながら、未知を楽しめるメンバーが集まっております。

