約5分で読めます
Development
VS CodeでReactプロジェクトをデバッグしたい話

はじめに
こんにちは、KINTO FACTORY のフロントエンド開発を担当しているきーゆのです。
今回は Visual Studio Code(以下 VS Code)で React プロジェクトをデバッグするための環境を構築した件について、まとめてみたいと思います。
これまで VS Code は優秀なメモ帳程度にしか使って来なかったので、結構苦戦しました(主に言語の壁)。
今まさに VS Code にデバッグの環境を構築しようとしている皆さん。
どうぞ私の屍を超えていってください。幸あれ。
環境情報
OS       : macOS Sonoma 14.1.2
VS Code  : ver1.85.1
Node.js  : 18.15.0
terminal : zsh
構築手順
1. launch.jsonのセットアップ
launch.jsonを追加して、デバッグ用の起動構成を構築していきます。
VS Code 左サイドメニューにある「実行とデバッグ」メニューを選択します。
選択後に表示される「launch.json ファイルを作成します」をクリックすると、launch.jsonファイルがプロジェクト内に作成されます。
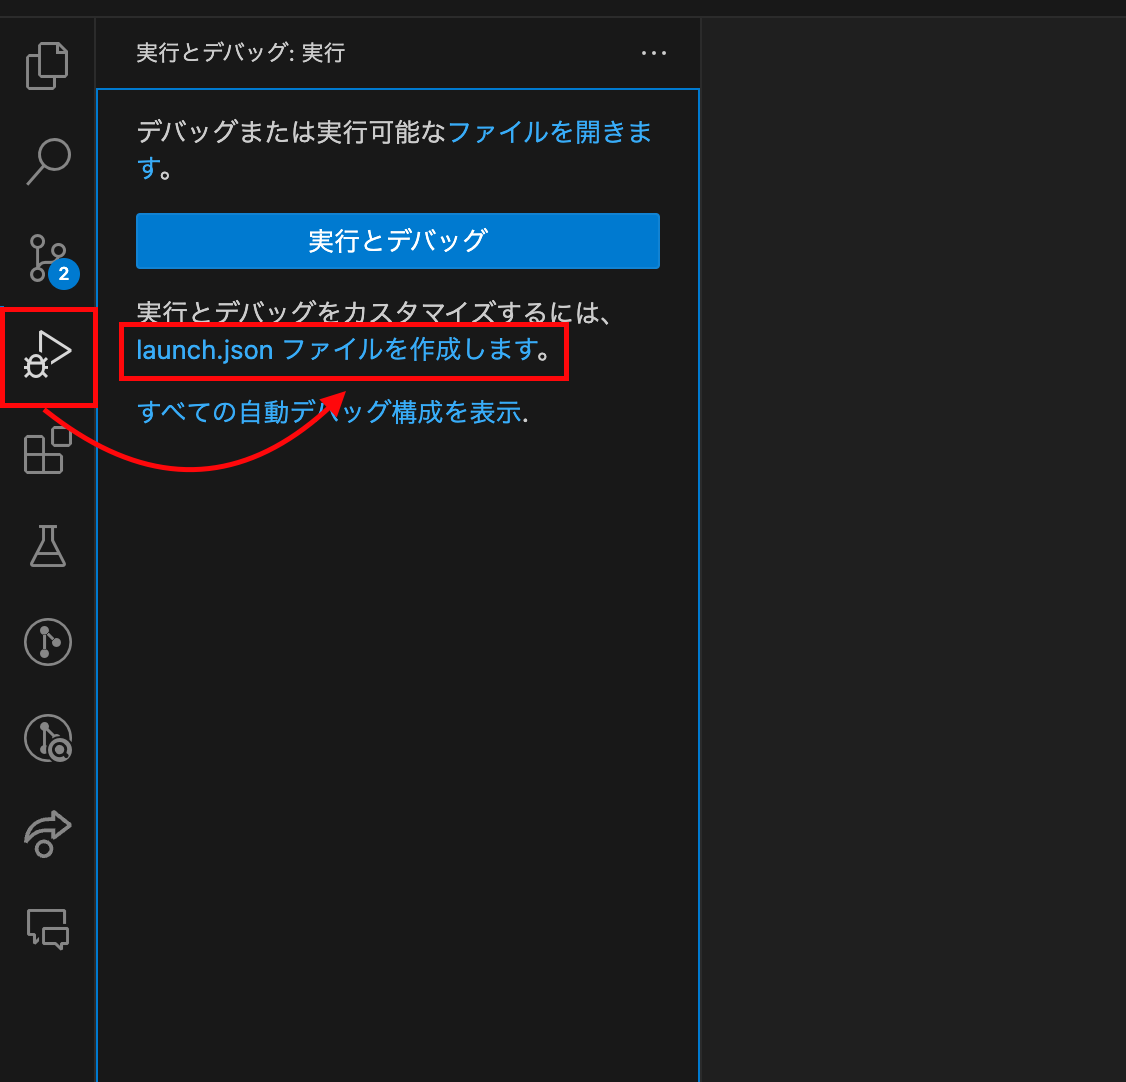
launch.json を作成します
作成直後のlaunch.jsonには、デフォルトの起動構成が追加されています。
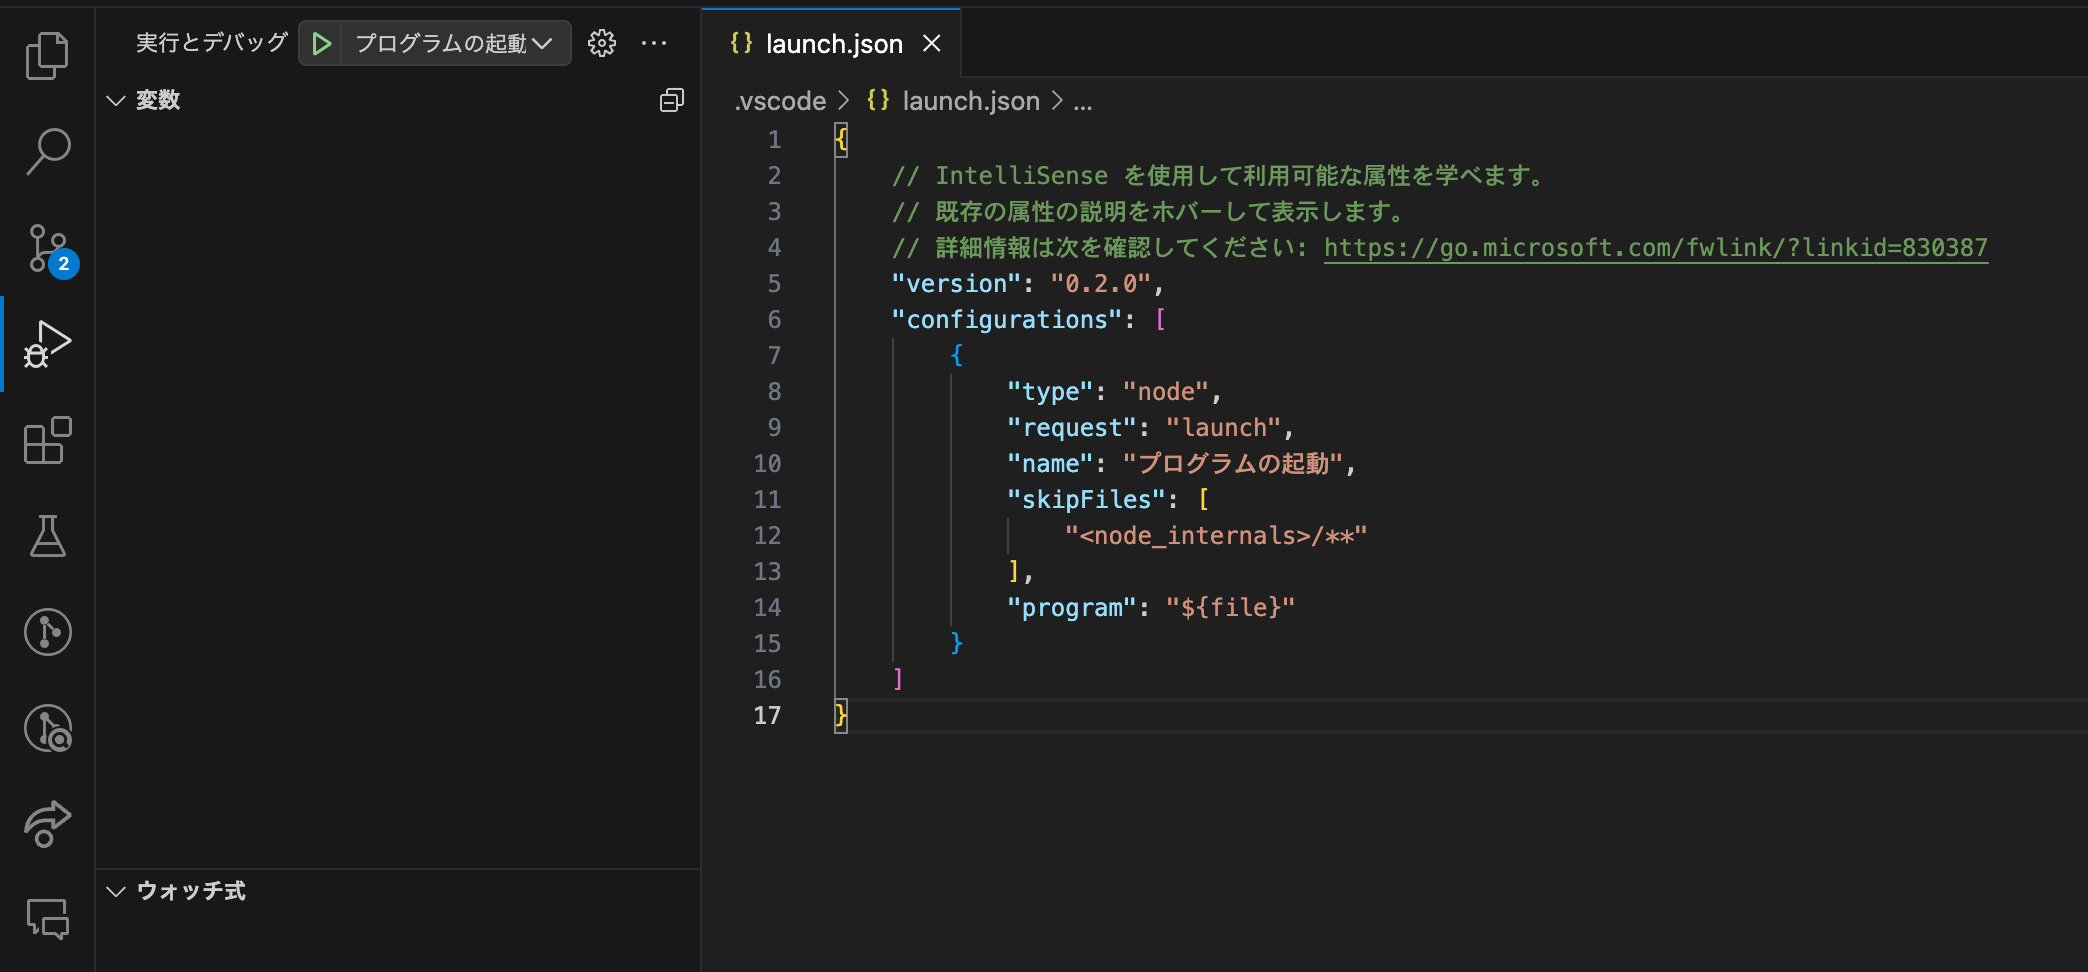
自動生成直後はデフォルトの起動構成が追加されています
2. 新しい起動構成の追加
先ほど追加したlaunch.jsonに、デバッグ用の起動構成を追加します。
追加する起動構成は以下になります。
{
    "name": "[localhost]Chromeデバッグ",
    "type": "node-terminal",
    "request": "launch",
    "command": "npm run dev",
    "serverReadyAction": {
        "pattern": "started server on .+, url: (https?://.+)",
        "uriFormat": "%s",
        "action": "debugWithChrome"
    },
    "sourceMaps":true,
    "trace": true,
    "sourceMapPathOverrides": {
        "webpack:///./*": "${webRoot}/src/*"
    }
}
編集後のlaunch.jsonは以下画像のようになります。
私はデフォルトの起動構成を削除しましたが、残しておいても特に問題はありません。
また、起動時のコマンドを変えたい場合はcommandプロパティを編集したり、デバッグ時に複数のコマンドを実行したい場合はpreLaunchTaskプロパティでタスクを追加したりすることも可能です(この辺の話は今回は割愛します)。
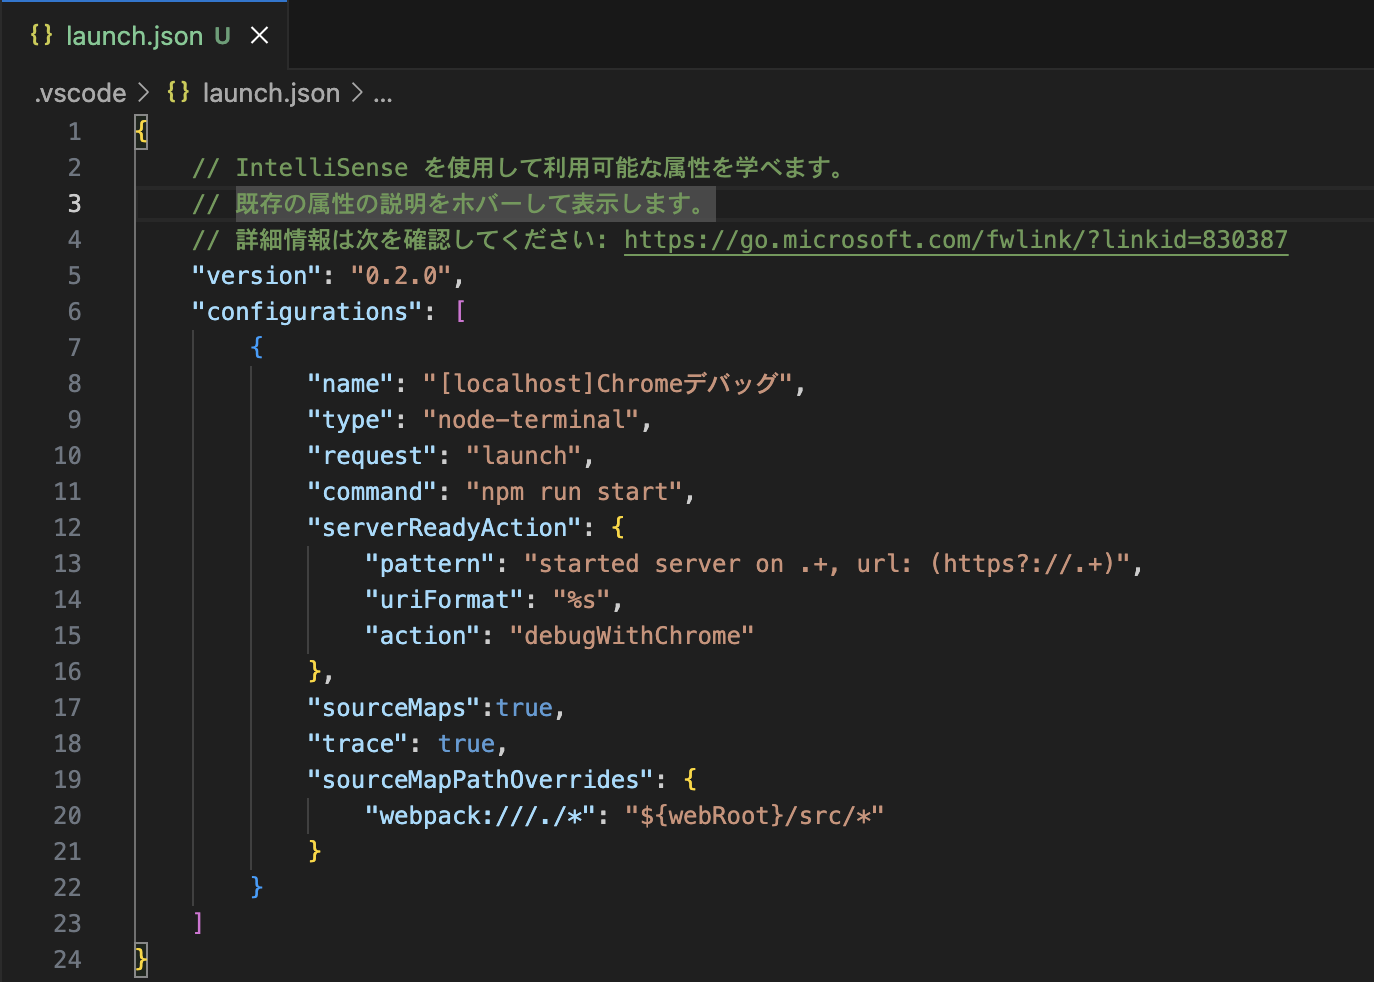
nameプロパティの値が起動構成の名前になります
3. デバッグ実行開始
あとは F5 キーを押すだけで、デバッガーが起動してくれます。
![]()
起動に成功すると中央上部にデバッグ用のボタンが表示されます
中央上部に表示されたデバッガーボタンや F キーを使って、ステップイン/ステップオーバー等を実行することができます。
困った時は
以下は私が実際に遭遇した"困った!"たちです。
運悪く遭遇してしまった方の一助になれば幸いです。
◽ デバッグ時のターミナルが"sh-3.2$"で実行され、"npm command not found"になる
VS Code を再起動することで解決します。
どうやら Microsoft によって自動的に VS Code が起動した場合に発生するようです。
私の環境の場合、PC 起動時 Microsoft365 にログインするのですが、ログイン成功時に VS Code も自動で起動するところでこの問題に遭遇しました。
◽️ npm インストール済みにも関わらずデバッグを開始すると"npm command not found"になる
.vscode/settings.jsonファイルに以下を追記してください。
ファイル自体を作成していない場合は、作成しておきましょう。
{
  // npm scripts コマンドを実行するためのpath設定
  "terminal.integrated.profiles.osx": {
    "zsh": {
      "path": "/bin/zsh",
      "args": ["-l", "-i"]
    }
  }
}
これによりデバッガーの実行ターミナルに path が通るようになり、npm コマンドを実行できるようになります。
まとめ
今回は VS Code で React プロジェクトをデバッグするための環境構築についてまとめてみました。
まだまだ VS Code で 遊べる 効率化できると思うので、次回はtasks.jsonでさらに効率化していければと思います。
これは私見ですが、開発時にデバッグできると QOL が爆上がりして開発生産性が向上します。
これによる副次的効果として、オフィス内での笑顔率向上や通勤時幸福度の向上が見込める...かもしれません。
皆さんのデバッグライフに幸あれ。
読んでいただき、ありがとうございました!
最後に、私の所属する KINTO FACTORY では一緒に働く仲間を募集しています。
ご興味があればぜひ下記の求人をチェックしてみてください!
関連記事 | Related Posts

![[続!Dev Container] GitHub Codespacesでクラウド開発環境を構築 cover](/assets/thumbnails/blog/authors/torii/codespaces/codespaces_banner.webp)

We are hiring!
シニア/フロントエンドエンジニア(React/Typescript)/KINTO中古車開発G/東京・大阪・福岡
KINTO開発部KINTO中古車開発グループについて◉KINTO開発部 :66名 KINTO中古車開発G:9名★ KINTOプロダクトマネジメントG:3名 KINTOバックエンド開発G:16名 契約管理開発G :9名 KINTO開発推進G:8名 KINTOフロントエンド開発G:...
シニアQAエンジニア(責任者候補)/Quality Engineering G/東京・大阪
「テストするQA」から「品質戦略を描くQA」へ。AIがコードを書くことが当たり前になりつつある今、品質保証のあり方そのものが問われています。