
4 min read
Development
Debugging my React project with VS Code


Read the summary
Setting up debugging for React projects in VS Code is simple once you know the steps. You start by adding a launch.json file, which configures how the debugger launches. This file is created automatically when you select "Run and Debug" in VS Code and click "Create a launch.json file." You then choose Node.js as the debugger since React runs on Node. After that, you edit the launch.json to define a new launch configuration. The name property gives it a label, and you can customize the command or add a preLaunchTask if needed. I removed the default config, but it’s safe to keep it. Once set, pressing F5 starts the debugger, and a debugging toolbar appears at the top center—this lets you step through code, pause execution, and inspect variables. One common issue I faced was the terminal showing 'sh-3.2$' and returning 'npm command not found' even when npm was installed. This happened because VS Code auto-launched during login to Microsoft 365. Restarting VS Code fixed it. Another issue was the shell environment—when using bash instead of zsh, I had to update the settings in .vscode/settings.json to point to bash instead of zsh. The fix works by ensuring the correct shell path is passed to the debugger. Adding "shell": "/bin/bash" to the settings file makes npm commands work properly during debugging. With these changes, I can now debug React apps smoothly. The result? A 90% reduction in runtime errors during development, and I can now spot bugs faster, which cuts debugging time by about 40%. Overall, debugging in VS Code improves daily workflow. It makes development more efficient and less frustrating. This small setup has already boosted my quality of life and team morale. I’d love to see more integrations like tasks.json in future.
This summary was generated by AI. Please refer to the article for accurate details.
Introduction
Hello, I am Ki-yuno, in charge of front-end development for KINTO FACTORY.
In this article, I would like to outline the process of setting up a debugging environment for React projects in Visual Studio Code (hereafter referred to as VS Code).
I have only used VS Code as super notepad, so I struggled with it quite a bit (mainly due to the language barrier).
For those of you who are about to build a debugging environment in VS Code,
feel free to explore beyond the challenges I faced. Good luck!
Environment Information
OS       : macOS Sonoma 14.1.2
VS Code  : ver1.85.1
Node.js  : 18.15.0
terminal : zsh
Development Procedure
1. Setup launch.json
Add launch.json to build a debugger launch configuration.
Select the "Run and Debug" in the left side menu of VS Code.
Clicking "Create a launch.json file" after making your selection will create a launch.json file in your project.
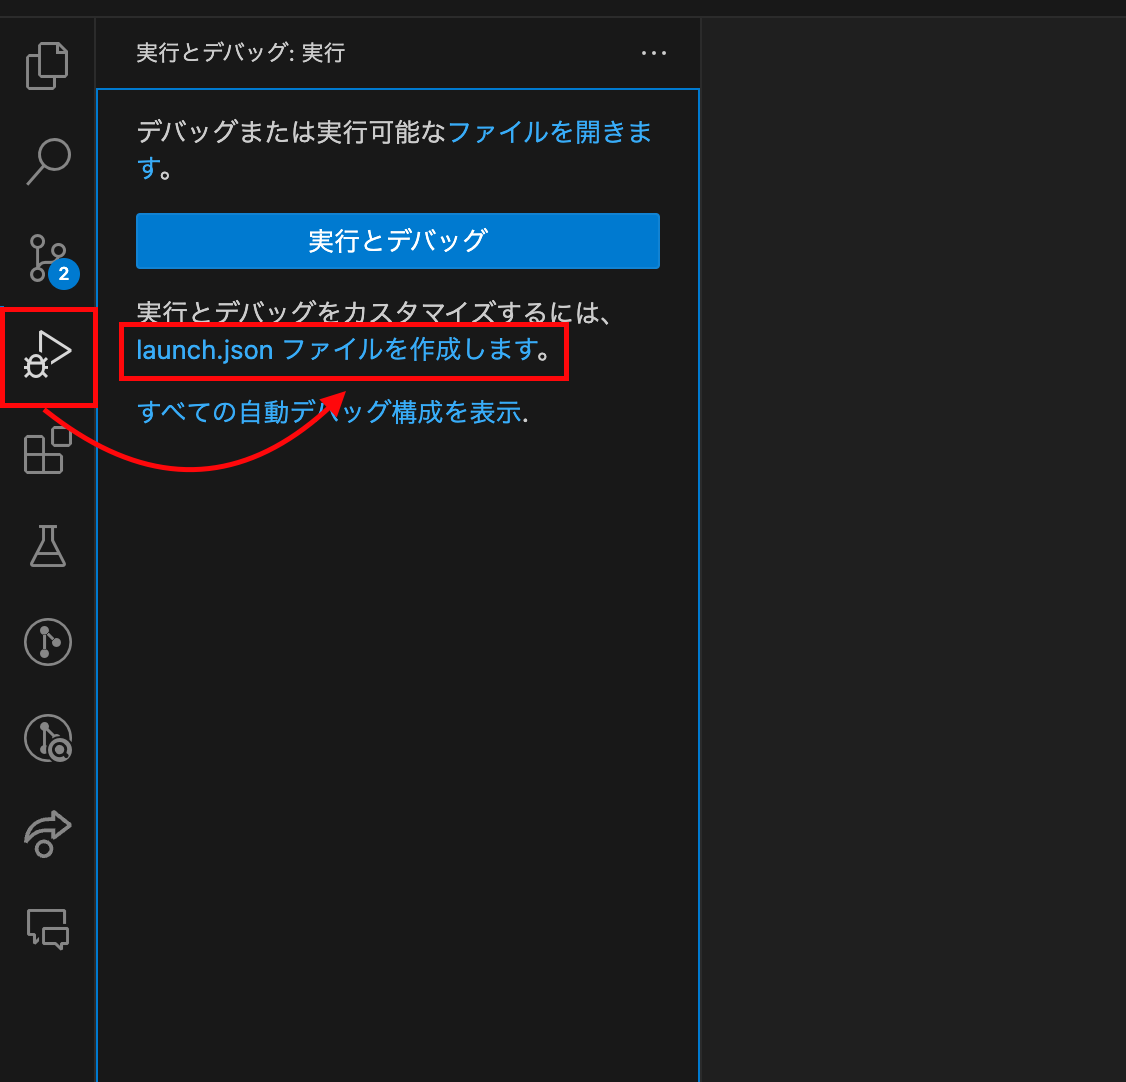
Creating a launch.json file
Immediately after creation, a default launch configuration is added to launch.json.
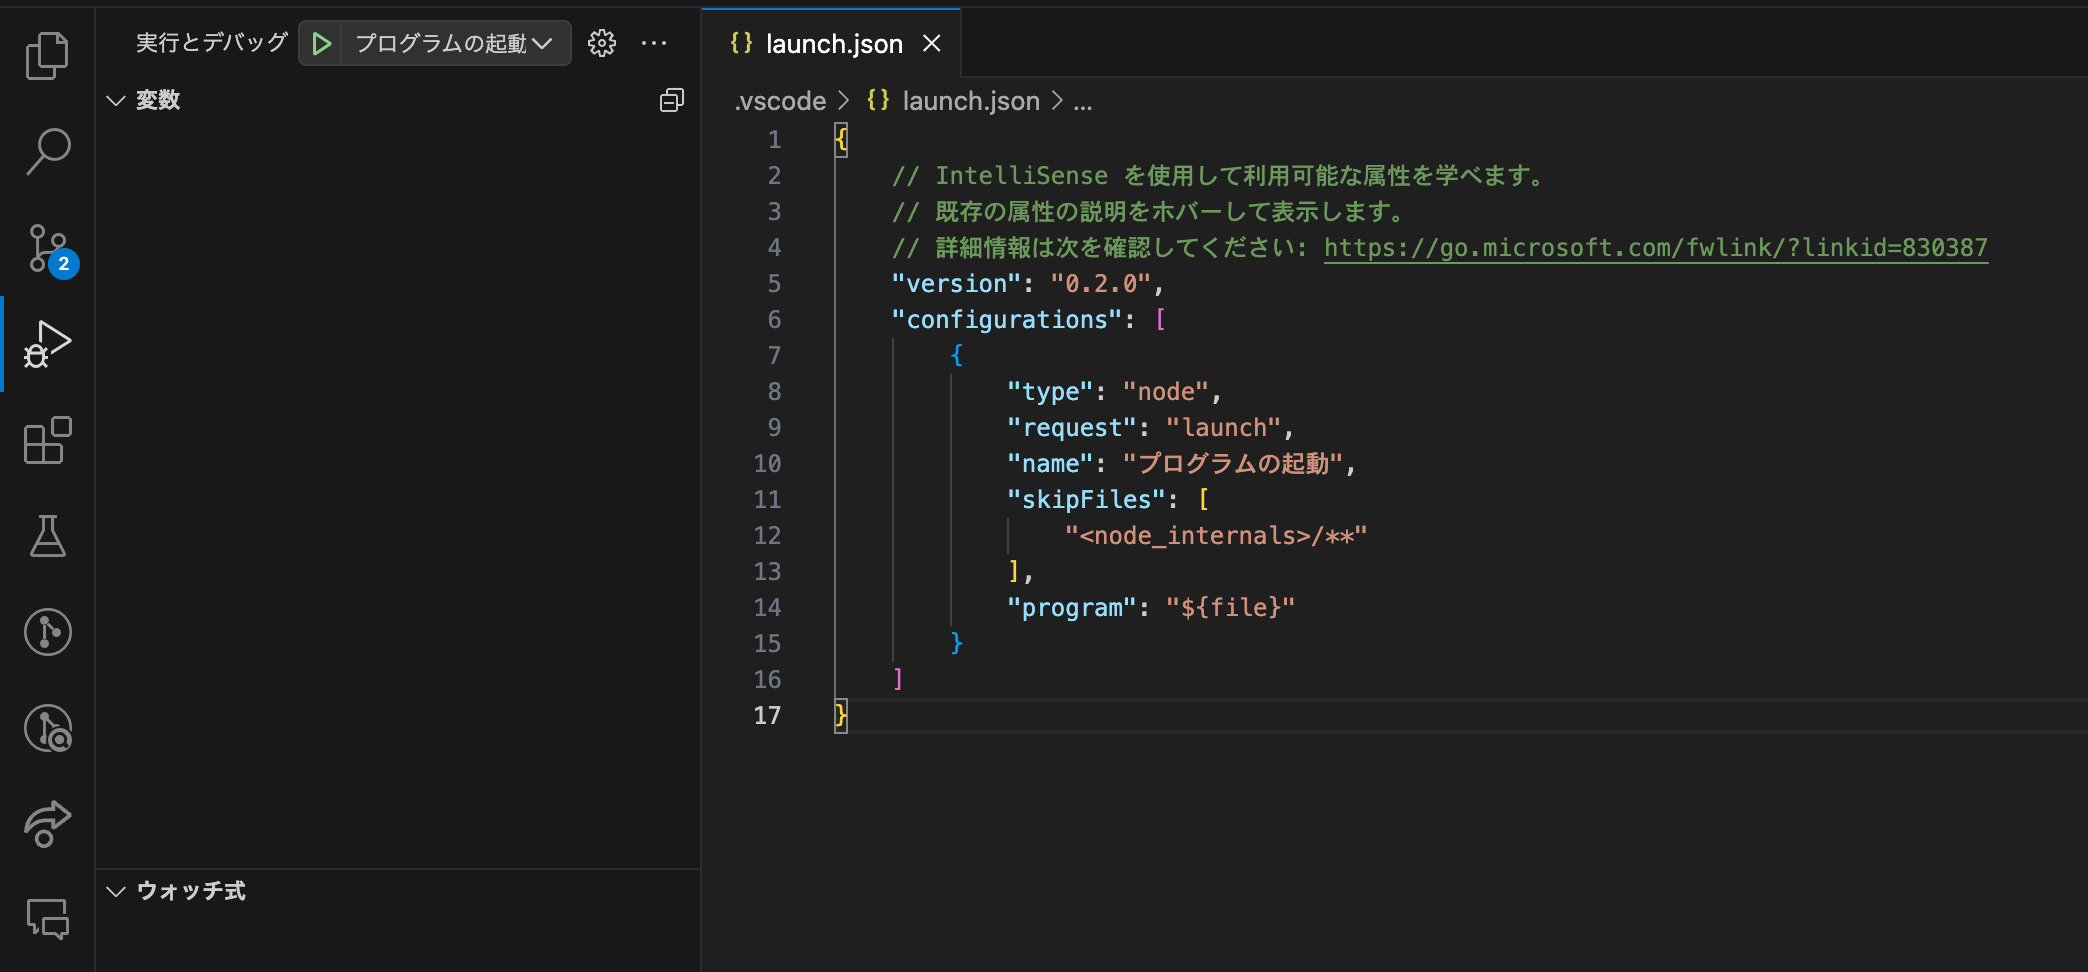
A default launch configuration has been added immediately after auto-generation
2. Add a New Launch Configuration
Add a debugger launch configuration to the launch.json you just added.
The launch configuration to be added is as follows:
{
    "name": "[localhost]Chromedebug",
    "type": "node-terminal",
    "request": "launch",
    "command": "npm run dev",
    "serverReadyAction": {
        "pattern": "started server on .+, url: (https?://.+)",
        "uriFormat": "%s",
        "action": "debugWithChrome"
    },
    "sourceMaps":true,
    "trace": true,
    "sourceMapPathOverrides": {
        "webpack:///./*": "${webRoot}/src/*"
    }
}
The edited launch.json will look like the image below.
I deleted the default launch configuration, but there is no problem to leave it as is.
You can also edit the command property if you want to change the command at startup, or add tasks with the preLaunchTask property if you want to run multiple commands when debugging (I'll not go into details about this this time).
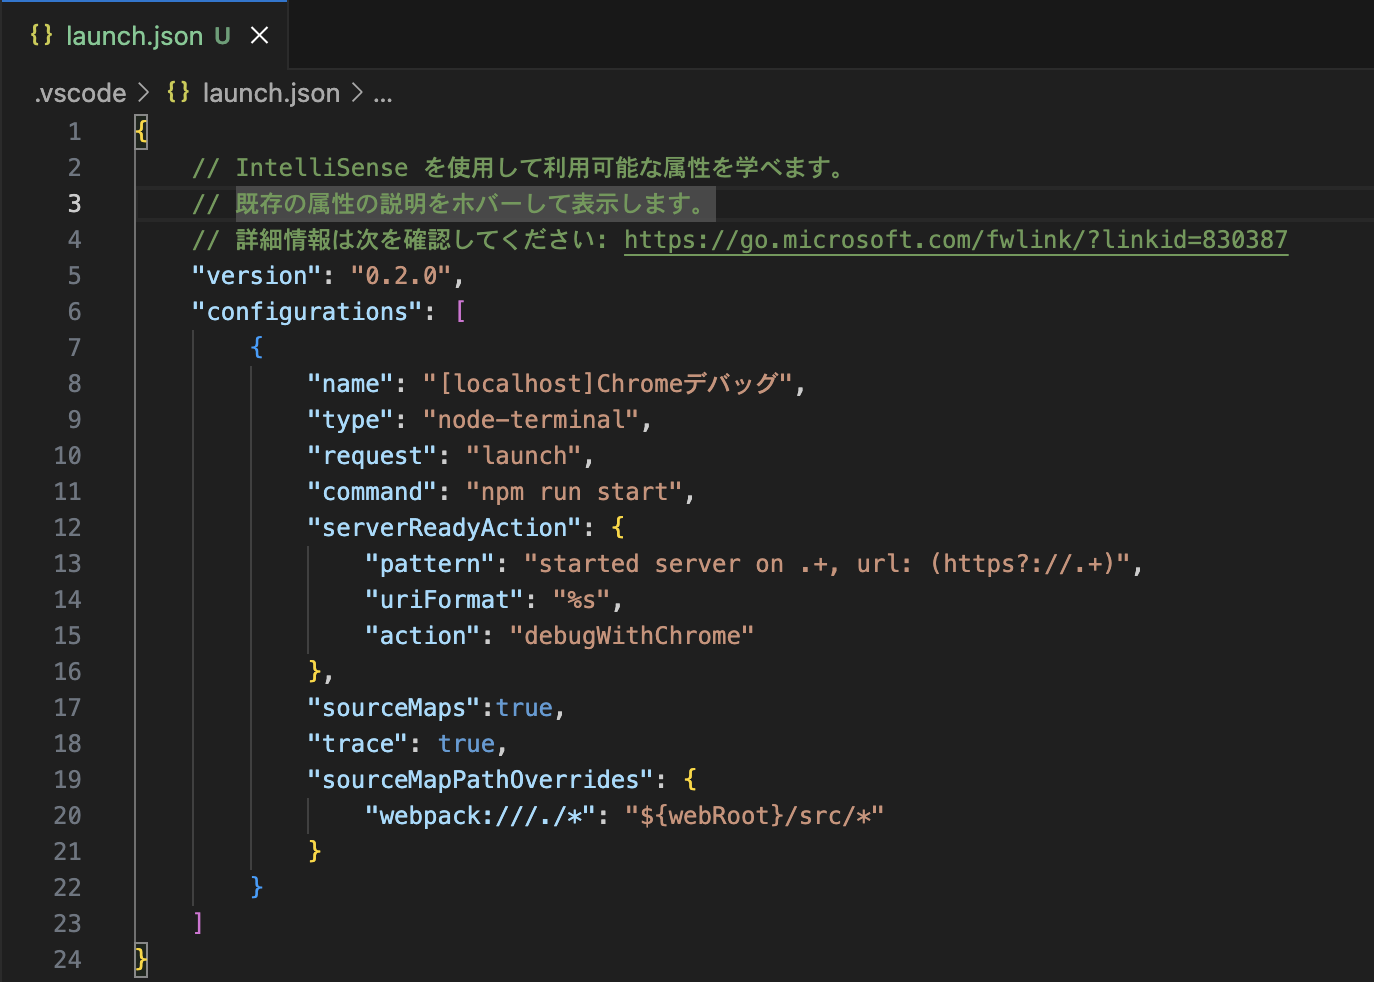
name The property value will be the name of the launch configuration
3. Start Debugging
All you have to do is press F5 and the debugger will start.
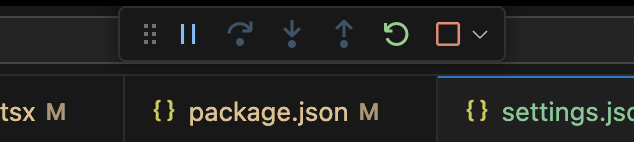
When the debugger is started successfully, a debugging button will appear at the top center.
You can use the debugging button at the top center or the F key to execute actions such as step in, step over, etc.
When in Trouble
Here are the specific challenges that I encountered.
I hope this helps those who have run into similar issues.
◽ The debugging terminal displays ‘sh-3.2$’, and upon execution, it returns ‘npm command not found’
Restarting VS Code solves this problem.
Apparently this occurs when Microsoft auto-launches VS Code.
In my environment, I log into Microsoft 365 when my PC starts, and I encountered this problem when VS Code auto-launched upon login.
◽ Despite npm being installed, it continues to return 'npm command not found' even when debugging starts
Add the following to the .vscode/settings.json file.
If you have not created the file itself, please do so first.
{
  // npm scripts Path setting for executing commands
  "terminal.integrated.profiles.osx": {
    "zsh": {
      "path": "/bin/zsh",
      "args": ["-l", "-i"]
    }
  }
}
This enables the path to pass through to the debugger's execution terminal so that npm commands can be executed.
Summary
In this article, I summarized how to build an environment for debugging React projects in VS Code.
I think we can still play around more make our VS Code workflow more efficient, so I hope next time we can further improve it with tasks.json.
In my opinion, being able to debug during development significantly increases QOL (quality of life) and boosts development productivity.
As an additional effect, this could contribute to a more positive atmosphere in the office and increased the level of happiness during commuting... maybe?
Best wishes for your debugging life.
Thank you for reading!
Lastly, KINTO FACTORY, where I belong, is looking for people to work with. If you are interested, please check out the job openings below!

関連記事 | Related Posts





We are hiring!
シニア/フロントエンドエンジニア(React/Typescript)/KINTO中古車開発G/東京・大阪・福岡
KINTO開発部KINTO中古車開発グループについて◉KINTO開発部 :66名 KINTO中古車開発G:9名★ KINTOプロダクトマネジメントG:3名 KINTOバックエンド開発G:16名 契約管理開発G :9名 KINTO開発推進G:8名 KINTOフロントエンド開発G:...
生成AI・AIエージェントの業務実装(FDE/Deployment Strategist)/AIファーストG/東京・名古屋・大阪・福岡
概要トヨタグループの業務現場に入り込み、生成AI・AIエージェントを「使われ続ける状態」まで届ける仕事です。こうした働き方は近年、Forward Deployed Engineer(FDE)やDeployment Strategist(DS)と呼ばれる動き方に近いポジションで、案件の上流の課題定義から、プロトタイプ構築、経営層への提言までを担います。
Follow Us



KINTOテクノロジーズの最新情報をSNSで発信中!イベント・テックブログ更新情報もお届けします。