OpenSearch Serverless を AWS Managed Grafana のデータソースとして使用する方法

はじめに
KINTOテクノロジーズ のプラットフォームエンジニアリングチームでは、現在のログソリューションに完全には満足していませんでした。そんな時、新しい AWS サービスを活用することでログプラットフォームを使いやすくし、コストも削減できるチャンスを見つけました。まさに一石二鳥です!
もちろん、既存のシステムをすべて取り壊して、新しいサービスに置き換えることはできません。それは、まだ走行中の車のエンジンを交換するようなものです!新しいサービスをどのように使い、どのように設定すれば私たちのニーズに合うかを調査する必要がありました。今回の新しいログプラットフォームとして OpenSearch Serverless を検討する中で、アラートシステムに関する解決策が必要でした。現在、OpenSearch クラスターの Alerting 機能を使用していますが、この機能はサーバーレスインスタンスでは使用できません。
幸い、AWS Managed Grafana バージョン 9.4 では、Grafana の OpenSearch プラグインが OpenSearch Serverless インスタンスをデータソースとして使用できるようになっており(Grafana Opensearch プラグインページ 参照)、 Grafana をアラートのために活用できるようになりました!しかし、両方のサービスをどのように設定すればうまく連携できるかを考える必要がありました。
調査の段階では、すでにOpenSearch Serverlessインスタンスを作成し、使用したいすべてのソースからのログインジェストをテスト済みでした。残されたタスクは、サンドボックスにテスト用の Grafana インスタンスをセットアップし、サーバーレスインスタンスをデータソースとして設定することでした。
本記事を書いている時点では、AWS ドキュメントにはこの手順に関する詳細な説明がありませんでした。エンジニアとして、すべての作業にステップバイステップのガイドが用意されているわけではありません。そのため、何が機能するかを探るために試行錯誤が必要でした。さらに、必要な権限を絞り込むため、 AWS サポートに協力を求め、Amazon Managed Grafana の内部チームと OpenSearch チームの両方にもリクエストをエスカレーションしてもらいました。ドキュメントがまだ整備されていないためです。これが、今回本記事を書いて知識を共有しようと考えた理由です。
続ける前に簡単に自己紹介:KINTOテクノロジーズでプラットフォームエンジニアをしているマーティンです。昨年、このチームに参加し、それ以来 AWS を使ったプロジェクトに断続的に関わってきました。
また、このプロジェクトに取り組む中で多くのことを学びました。今回その経験を皆さんと共有できることをとても嬉しく思います!
プロジェクトから得た最大の学びは、AWS サポートが素晴らしいリソースであり、困ったときには遠慮せずにサポートを依頼するべきだということです。
環境の設定
本記事では、AWS コンソールを使ってすべて設定します。もちろん、お好きな Infrastructure as Code ツールを使って同じ設定を作成も可能です。本記事では、読者が AWS コンソールに精通していて、すでに Opensearch Serverless インスタンスが稼働していることを前提としています。
なお、本記事で紹介する設定はシンプルさを優先しているため、セキュリティ要件に応じて設定を見直し、調整することを強くお勧めします。
IAM ロールの設定
最初に、Grafana インスタンスで使用するための IAM ロールを作成する必要があります。もし Grafana ワークスペースで他の AWS サービスを利用する予定がある場合、Grafana ワークスペース作成時に [サービス管理] オプションを選択したほうがよいかもしれません。その後、AWS が作成したロールを更新するか、Grafana のデータソース設定時にカスタムロールのARNを指定できます。
IAM ロールを作成する際に必要な信頼ポリシーは以下のとおりです。
{
    "Version":"2012-10-17",
    "Statement": [
        {
            "Effect":"Allow",
            "Principal": {
                "Service": "grafana.amazonaws.com"
            },
            "Action": "sts:AssumeRole"
        }
    ]
}
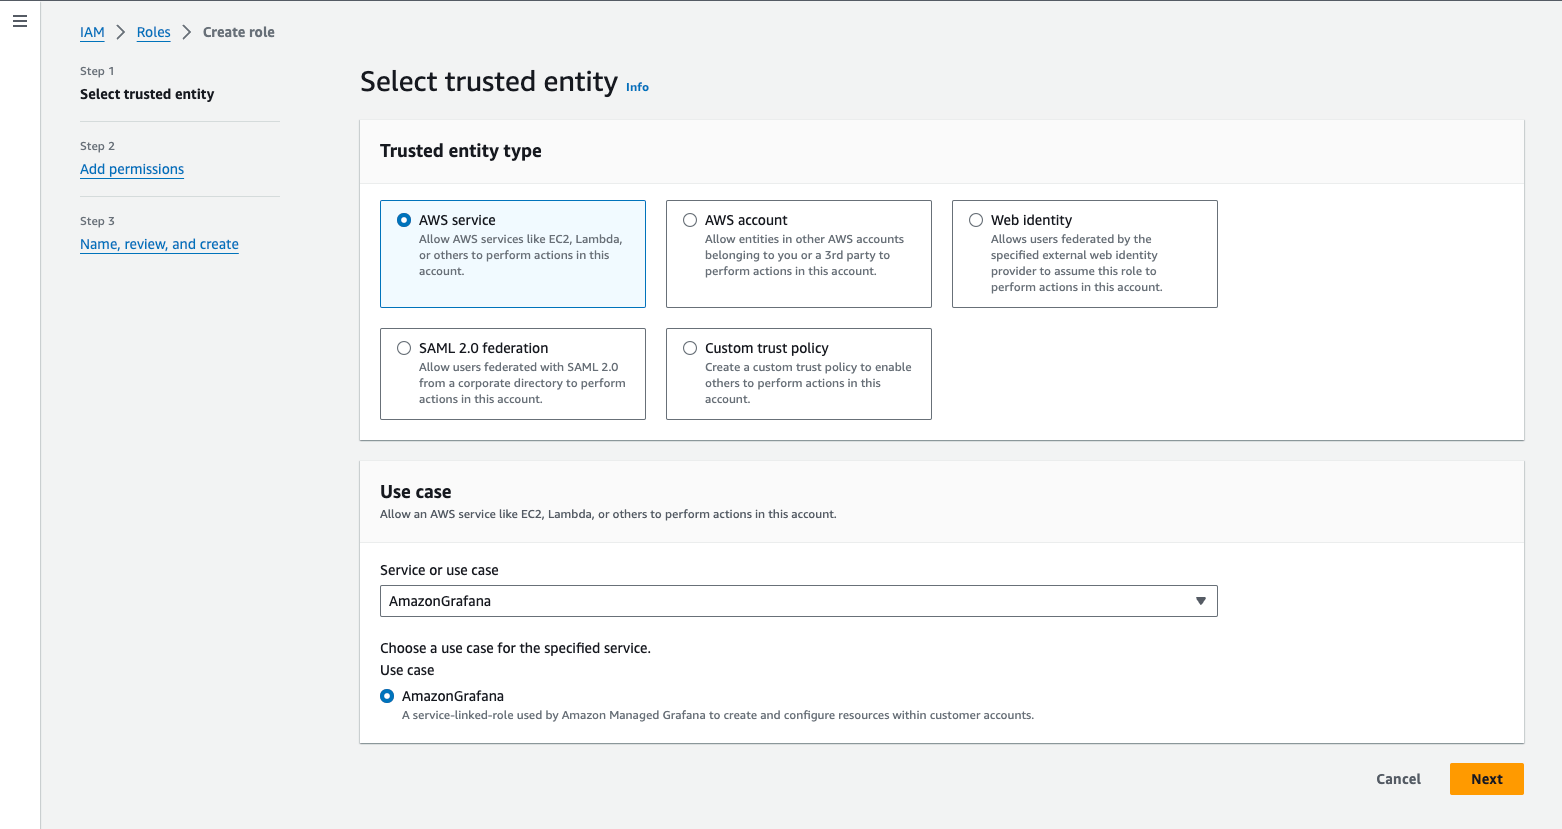
AWS サービスの「Trusted entity type (信頼されたエンティティのタイプ)」で AmazonGrafana を選択することで、同じ信頼ポリシーを取得できます。(使用例のセクションで選択します。)
GrafanaからOpenSearch Serverlessにアクセスするために必要な権限ポリシーは以下のとおりです。GrafanaチームとOpenSearchチームに最小限の必要な権限を提供するようリクエストをエスカレーションしてくださったAWSサポートチームに、感謝します。
{
    "Statement": [
        {
            "Action": [
                "es:ESHttpGet",
                "es:DescribeElasticsearchDomains",
                "es:ListDomainNames"
            ],
            "Effect":"Allow",
            "Resource": "*"
        },
        {
            "Action": "es:ESHttpPost",
            "Effect":"Allow",
            "Resource": [
                "arn:aws:es:*:*:domain/*/_msearch*",
                "arn:aws:es:*:*:domain/*/_opendistro/_ppl"
            ]
        },
        {
            "Action": [
                "aoss:ListCollections",
                "aoss:BatchGetCollection",
                "aoss:APIAccessAll"
            ],
            "Effect":"Allow",
            "Resource": [
                "arn:aws:aoss:<YOUR_REGION>:<YOUR_ACCOUNT>:collection/*"
            ]
        }
    ],
    "Version":"2012-10-17"
}
OpenSearch アクセスポリシー
OpenSearch 側では、新しく作成した IAM ロールに対してデータアクセスポリシーを追加する必要があります。IAM ロールに OpenSearch へアクセスするための必要な権限を付与していたとしても、コレクション内のデータにアクセスできるようにするためには、データアクセスポリシーを作成する必要があります。詳細については、AWS のドキュメント を参照してください。
OpenSearch サービスページのメニューで、のサーバーレスセクションにある「データアクセスポリシー」を選択し、「アクセスポリシーの作成」ボタンをクリックします。アクセスポリシーに名前と説明を追加し、ポリシー定義方法として JSON を選択します。以下のポリシーは、Grafana Opensearch プラグインのドキュメントから引用したものです。
 [
  {
        Rules = [
          {
            ResourceType = "index",
            Resource = [
              "index/<NAME_OF_YOUR_OPENSEARCH_INSTANCE>/*"
            ],
            Permission = [
              "aoss:DescribeIndex",
              "aoss:ReadDocument"
            ]
          },
          {
            ResourceType = "collection",
            Resource = [
              "collection/<NAME_OF_YOUR_OPENSEARCH_INSTANCE>"
            ],
            Permission = [
              "aoss:DescribeCollectionItems"
            ]
          }
        ],
        Principal = [
          <GRAFANA_IAM_ARN>
        ]
        Description = "Read permissions for Grafana"
      }
    ]
OpenSearch Serverless デプロイメントの名前と、先ほど作成した IAM ロールの ARN を更新してください。
ネットワーキングの設定を少し行います
Grafana インスタンスの作成を続ける前に、いくつかのネットワークリソースを作成します。
まず、OpenSearch Serverless デプロイメントと同じ VPC 内に 2 つのサブネットを作成しましょう。各サブネットは異なるアベイラビリティーゾーンに配置する必要があります。
サブネットが作成されたら、各サブネットのルートテーブルを更新し、0.0.0.0/0 からインターネットゲートウェイへの新しいルートを追加します。
次に、VPC からのインバウンド HTTPS トラフィックを許可し、0.0.0.0/0 へのすべてのアウトバウンドトラフィックを許可するセキュリティグループを作成します。
これらの設定が完了したら、Grafanaインスタンスを作成する準備が整いました!
Grafana インスタンスの作成
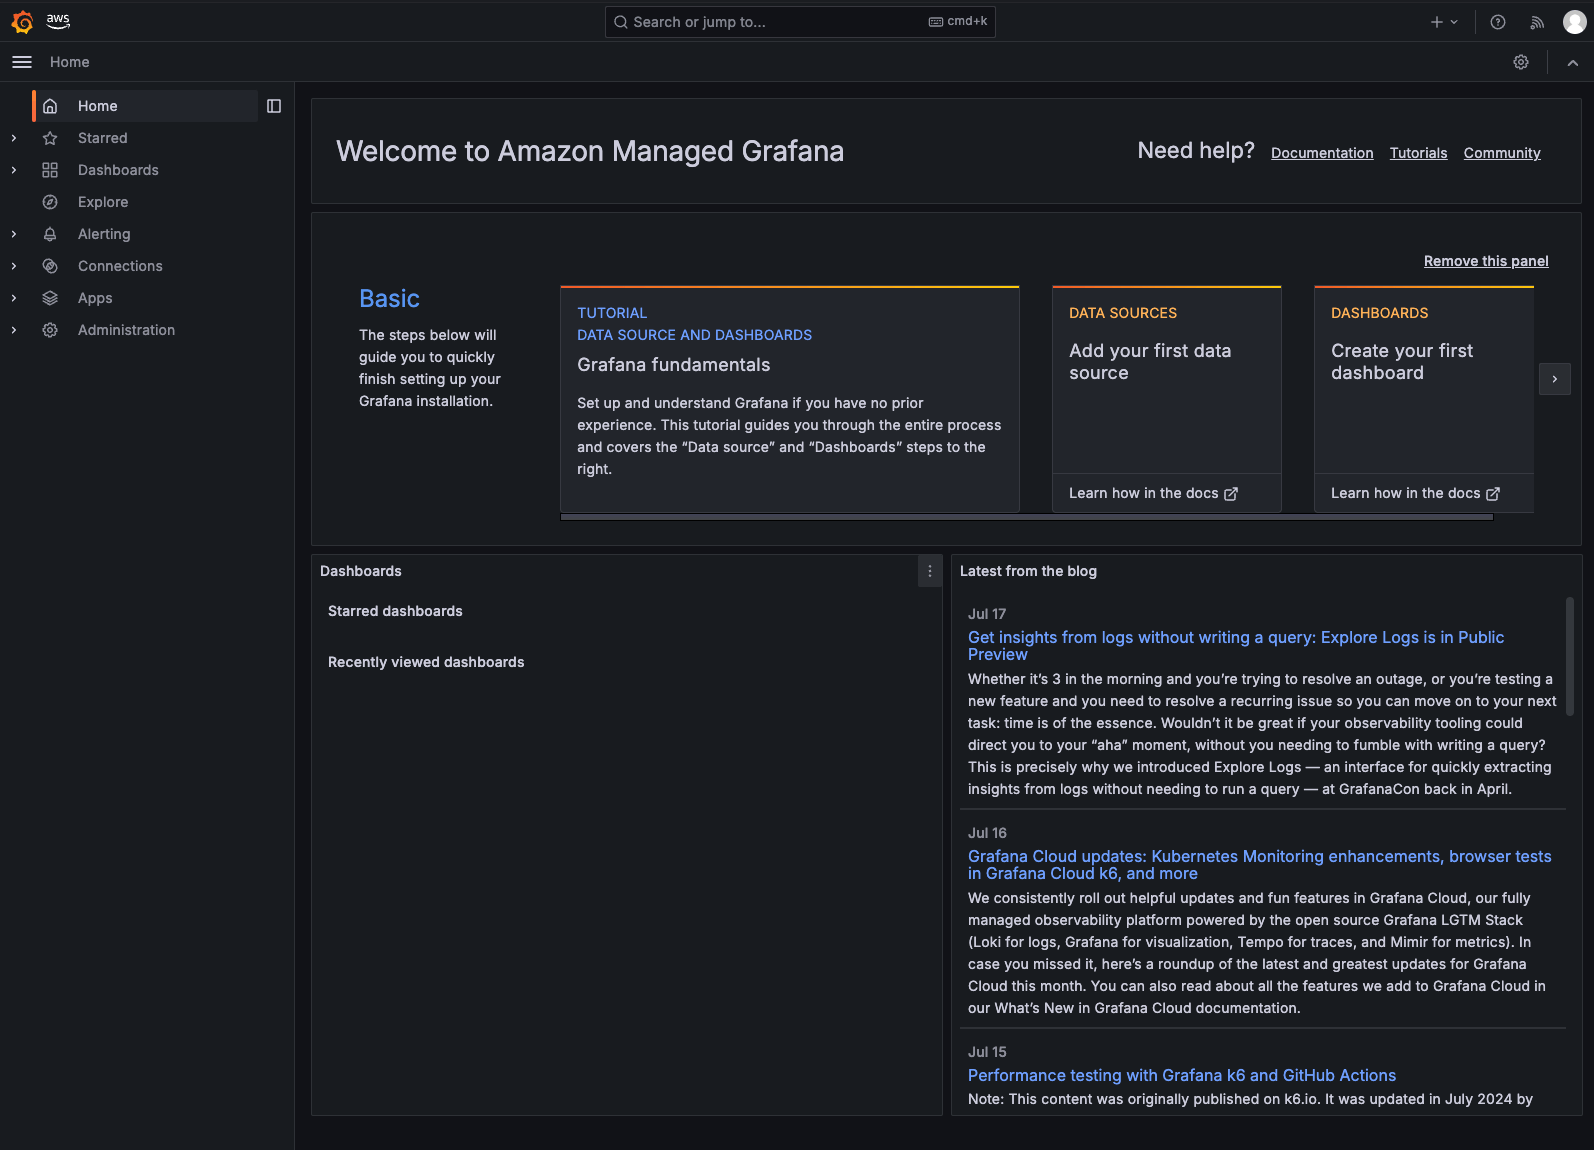
コンソールの検索バーで Amazon Managed Grafana サービスを検索します。
サービスのホームページで、AWS エンジニアが配置した便利なボタンを使用して Grafana ワークスペースを作成します。
作成ページの最初のステップで、Grafana ワークスペースの名前と説明を設定します。バージョンを 少なくとも9.4 以上に設定してください。最新バージョンは10.4なので、私はそちらを使用します。
次のページの認証方法の選択では、お好みの認証方法を選んでください。私は AWS IAM Identity Center を選びます。
Permission type (権限の種類)では、Customer managed を選択し、先ほど作成した IAM ロールの ARN を指定します。Grafanaワークスペースを作成した後、選択したロールとは別のIAMロールが使われてしまうという奇妙な問題が発生しました。そのため、正しいロールを使うようにワークスペースを更新する必要がありました。これはバグか、私の設定ミスかもしれませんが、本記事では、私は間違いなく正しいロールを選んだということにしておきます。そして、バグだったということにしましょう。OKでしょうか?Great! 進めましょう!
Outbound VPC connection (アウトバウンドVPC接続)のセクションでは、OpenSearch Serverless インスタンスがデプロイされているのと同じ VPC を選択します。Mapping and Security Groups (マッピングとセキュリティグループ)では、先ほど作成したサブネットとセキュリティグループを選択します。
Workspace configuration options (ワークスペース構成オプション)のセクションでは、Turn plugin management on (プラグイン管理を有効にする)を必ず選択してください。
このチュートリアルでは、 Network access control (ネットワークアクセス制御)のセクションで Open Access (オープンアクセス)を選択します。
[次へ] ボタンをクリックして、設定を確認します。
ワークスペースが作成されたら、認証方法を設定してください。私は AWS IAM Identity Center を選択したので、自分のユーザーを追加し、管理者にします。
これで接続できるようになったはずです!
Grafana と OpenSearch Serverless の連携
OpenSearch Serverless データソースを追加する前に、Grafana ワークスペースに OpenSearch プラグインをインストールする必要があります。これを行うには、次の手順に従ってください。
- 左側のメニューから、[Administration]を選択し、[Plugins and Data]、そして[Plugins] を選択します。
- プラグインのページで、ページ上部のフィールドで「Installed」ではなく「All」を選択します。
- OpenSearch プラグインを検索してインストールします。インストールが完了すると、OpenSearch プラグインページの右上に [Add new data source] ボタンが表示されます。クリックしてください。
次に、OpenSearch Serverless インスタンスに接続するためのデータソース情報を設定します。 - HTTP セクション:URL フィールドに OpenSearch Serverless インスタンスの URL を入力します。
- Auth セクション:SigV4認証をオンにして、OpenSearch Serverless インスタンスが配置されているリージョンを選択します。
- OpenSearch Details セクション:Serverless をオンにして、使用するインデックスを設定します。
- Logs セクション:メッセージフィールドとレベルフィールドの名前を設定します。
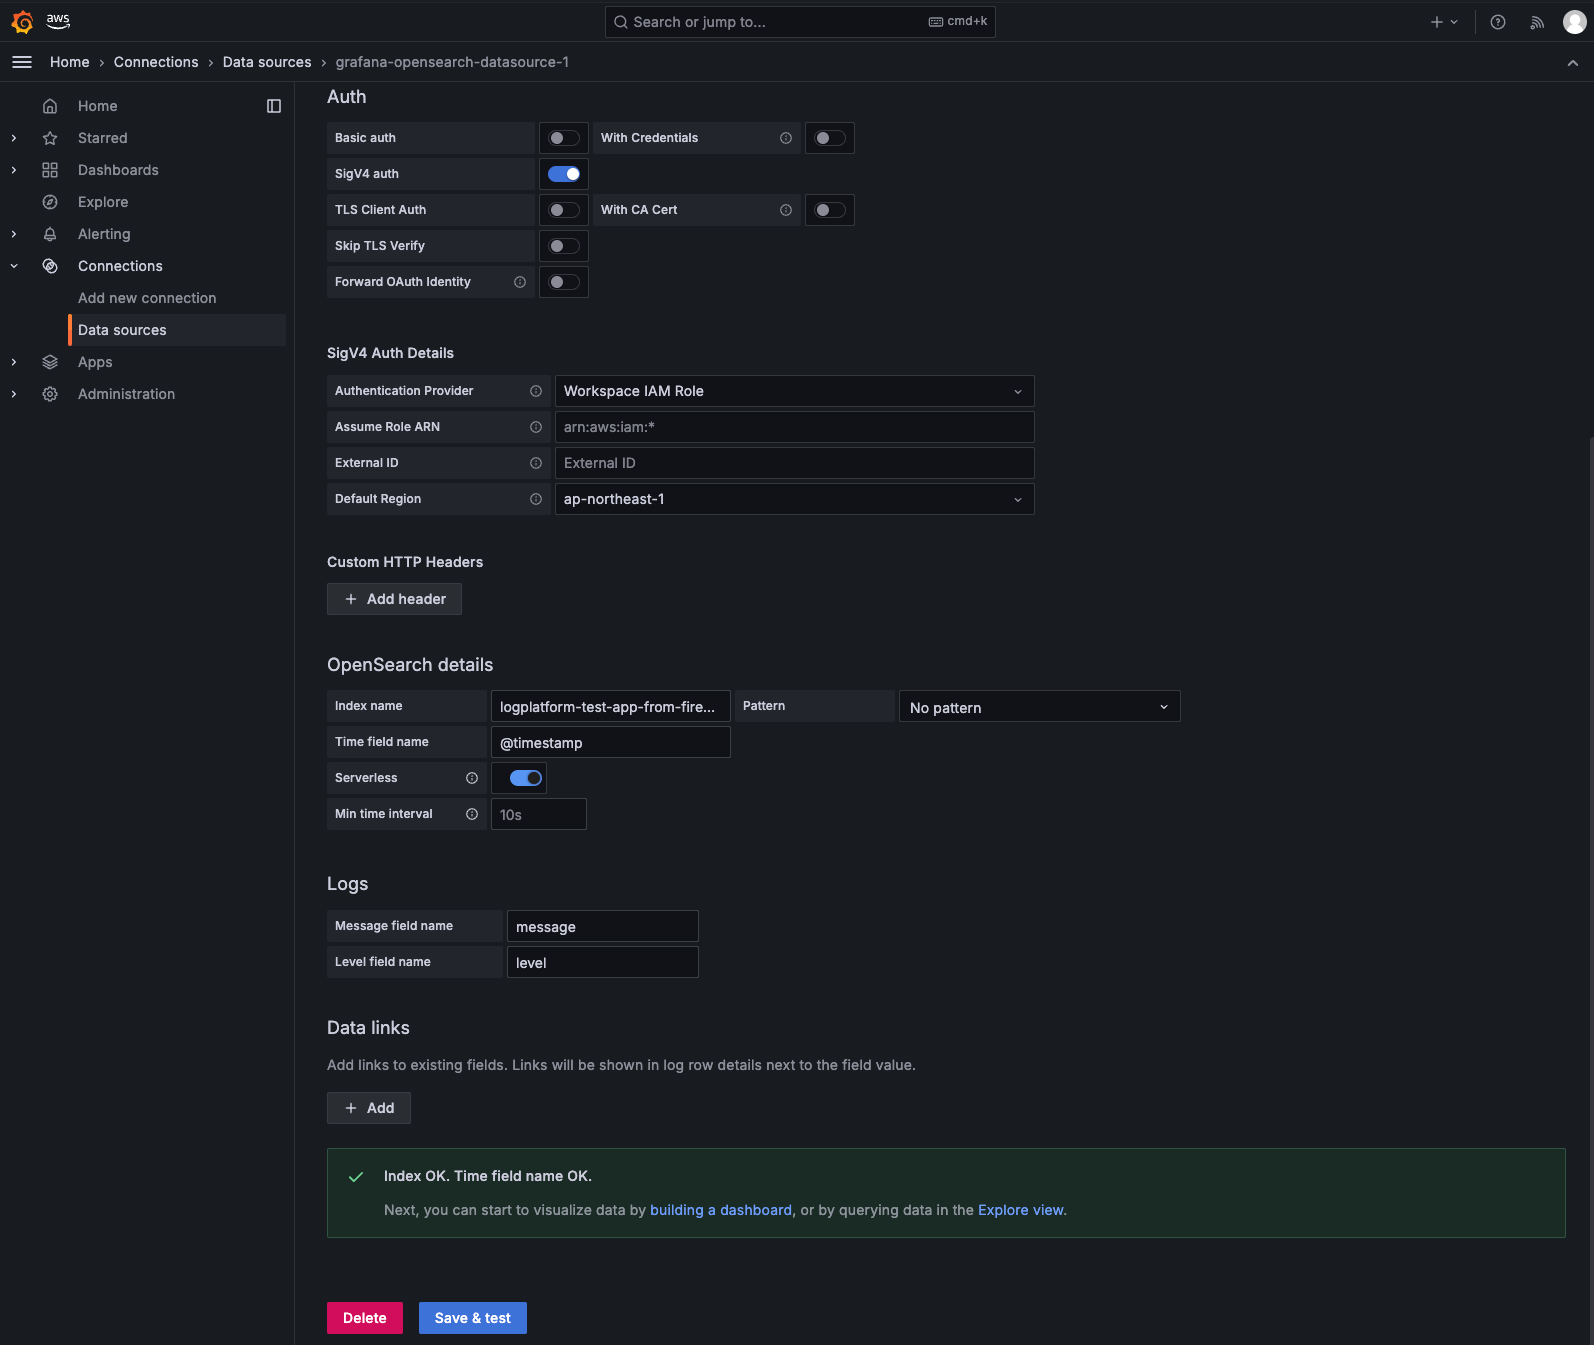
最後に、[Save & test] をクリックします。正常に接続されたことを確認するメッセージが表示されるはずです。これで、このデータソースを使用してアラートとダッシュボードを作成できるようになりました!
さいごに
本記事が役に立ち、OpenSearch Serverlessをデータソースとして使用し、ご自身のGrafanaインスタンスをセットアップできるようになっていれば幸いです。
私たちKINTOテクノロジーズにとって、アラートにGrafanaを使用することは、新しいロギングソリューションにとって素晴らしい選択肢のように思えます。この設定により、堅牢で効率的、かつコストパフォーマンスに優れたログとアラートのソリューションを構築でき、私たちの仕様に合致するものとなります。個人的には、Grafanaでのアラートクエリの作成はOpenSearchと比べて、よりシンプルで柔軟だと感じました。
ちなみに、KINTOテクノロジーズのプラットフォームグループでは新しい仲間を募集しています!私たちは、常に優秀なエンジニアを募集しています。チームに参加することに興味がある場合や、私たちの仕事や職場環境について詳しく知りたい場合は、ぜひお気軽にお問い合わせください!私たちの求人一覧が掲載されたウェブページもありますので、ぜひご覧ください。こちら
関連記事 | Related Posts
OpenSearch Serverless を AWS Managed Grafana のデータソースとして使用する方法
Getting Started with Prometheus, Grafana, and X-Ray for Observability (O11y)

Getting Started with Bedrock Knowledge Base Using Terraform
Building Cloud-Native Microservices with Kotlin/Ktor (Observability Edition)
Practicing Observability with Grafana from a BE Engineer's Perspective
Prometheus + Grafana + X-Rayで始めるO11y
We are hiring!
【クラウドエンジニア】Cloud Infrastructure G/東京・大阪・福岡
KINTO Tech BlogWantedlyストーリーCloud InfrastructureグループについてAWSを主としたクラウドインフラの設計、構築、運用を主に担当しています。
【クラウドプラットフォームエンジニア】プラットフォームG/東京・大阪・福岡
プラットフォームグループについてAWS を中心とするインフラ上で稼働するアプリケーション運用改善のサポートを担当しています。
イベント情報
![[Mirror]不確実な事業環境を突破した、成長企業6社独自のエンジニアリング](/assets/banners/thumb1.png)