Use Social Media to Attract Customers! A Look Back on 4 Months of Social Media Marketing
Hello! My name is Kita and I work on a travel media platform called Prism Japan (for Web, iOS, and Android) at KINTO Technologies. Since November 2024, I've been working on social media management for Prism Japan. Going beyond traditional advertising, the goal is to actively use social media as a way to grow brand awareness and create a channel to attract new customers. So here's a quick look back at how things went over the past four months!
What We Achieved
Let’s begin by looking at what we’ve accomplished while managing our social media accounts.
-
Creating short-form videos
Short-form content, especially on TikTok and Instagram, is a key element in today's social networking environment. The algorithms are designed to show short videos to users beyond your followers, and depending on how viewers react, your reach can grow quickly. Increasing awareness using social media was a required subject, so we started by imitating popular videos that were going viral in similar categories. Based on those ideas, I picked up editing skills by experimenting with different editing tools. Here are the main tools I used:Tool Name Features Canva Has a free plan available at no cost Images and videos can be freely edited and easily shared with co-editors, making management simple. There was only one time the server crashed during editing, and I had to start over. Adobe Express Has a free plan available at no cost It's not much different from Canva, but I personally prefer this one because the server is stable that I never experienced any crashes while working. Capcut Has a free plan available at no cost Its main feature is video editing. It offers tons of social media-friendly features, such as text-to-speech, 3D image conversion, and the ability to use fonts that are commonly seen on social media.
Note: The watermark in the free version doesn’t go over well on Instagram.Depending on your goals and preferences, you might favor one tool over another, but generally, all of them can get the job done—even with their free versions.
-
Gaining impressions
Across all platforms, we were able to gain a lot of impressions. Let's take a look at the period from November 1, 2024, when the full-scale operations started, to March 17, 2025 (the time of writing).
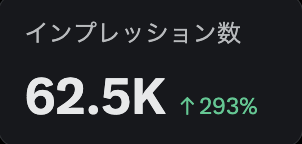
X
Impressions increased 293% to 62,500.
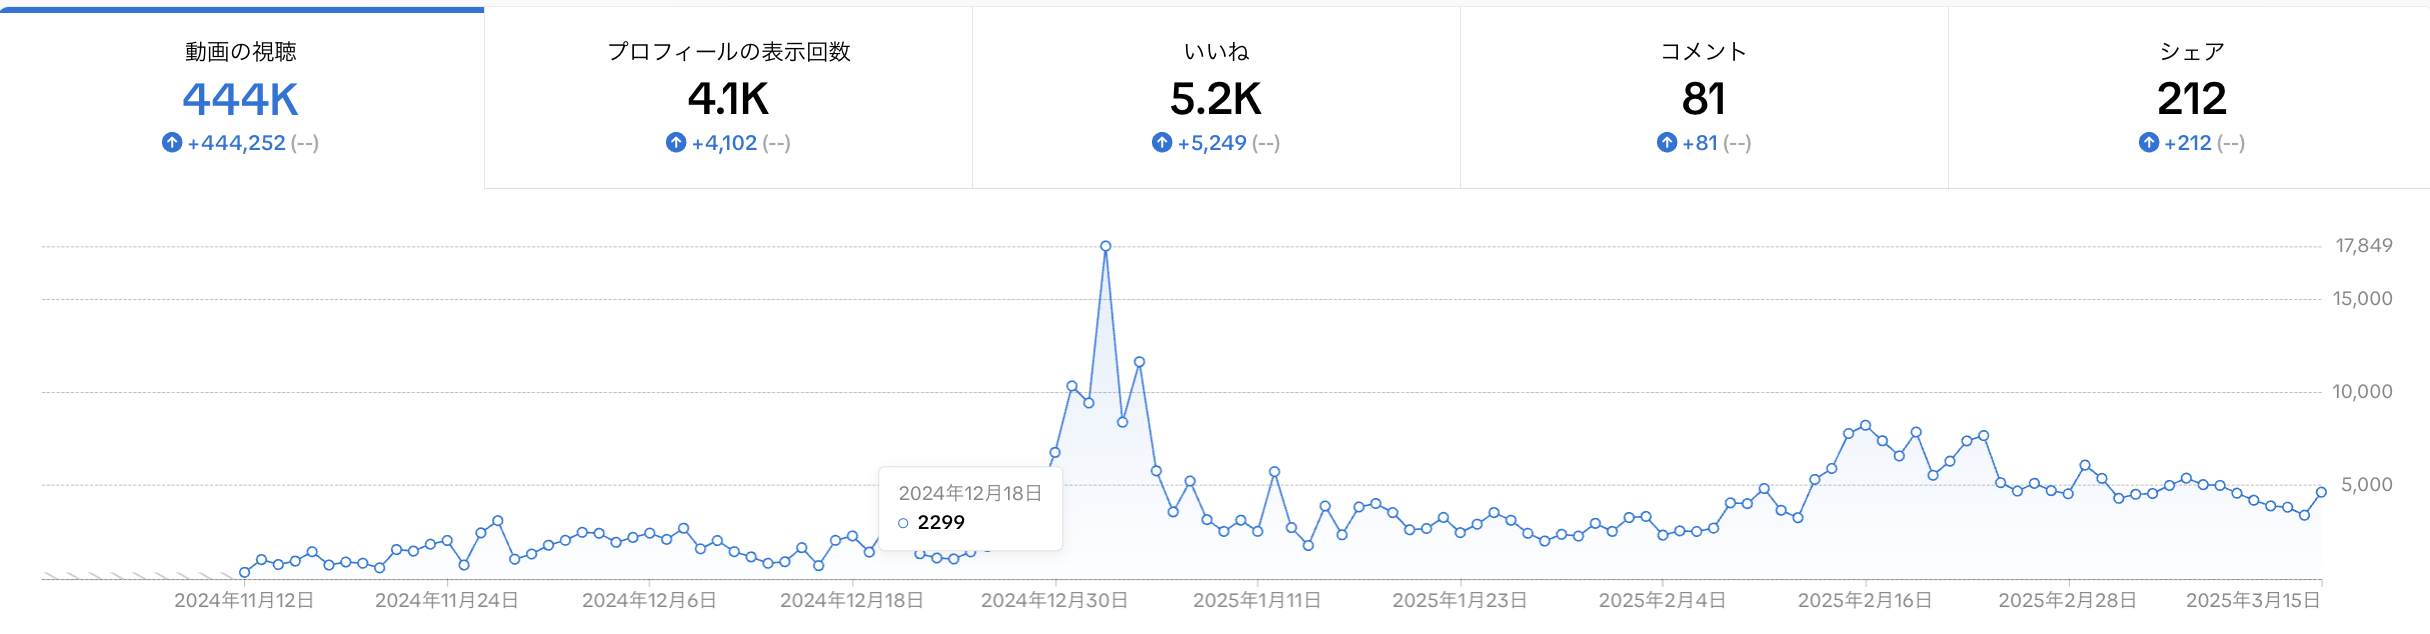
Tiktok
Since we only started using TikTok during this period, there’s no earlier data to compare, but our videos have been viewed 440,000 times so far. Compared to other platforms, it appeared to steadily accumulate views over time.
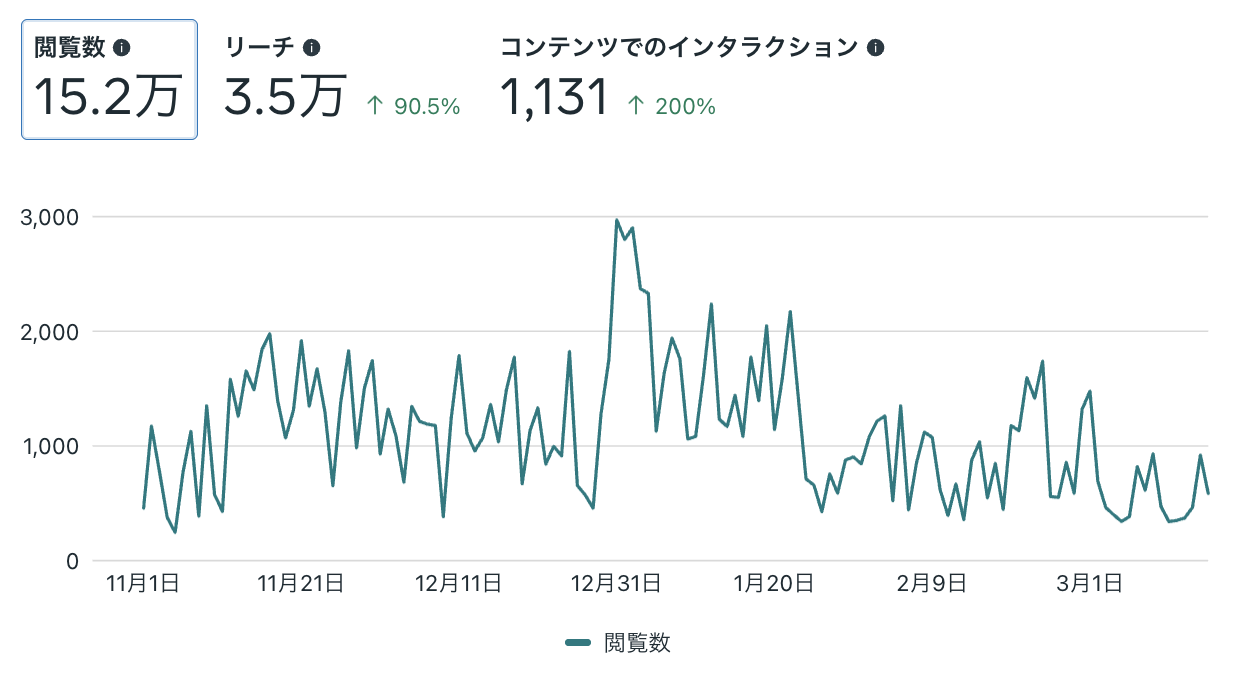
Instagram
Reach increased by 90%, reaching 50,000.
*Note: Accurate comparisons for views and interactions couldn’t be made due to the absence of data prior to August 2024.
This is especially noticeable on TikTok and Instagram, with peaks occurring around the New Year period. We think this growth was driven by a combination of people being on holiday and a well-timed post introducing shrines that were perfect for the New Year's visits. When comparing the period before and after full-scale social media operations, factors like posting more frequently and simply being active on the platforms definitely played a role. However, what really helped boost views was tapping into trends like video format, seasonality, and timely topics. I'd say these efforts helped "raise awareness" to some extent.
-
Communication with users
On X in particular, we were able to discover and connect with new audiences. Previously, we hadn't taken any active steps like following users or replying to posts. But since X prioritizes engagement in its algorithm, we began directly interacting with users interested in tourism. As a result, one user not only installed our app, but also posted a review after actually visiting one of the spots we featured! Even better, they gave us some great content ideas. If you have a product or service, I definitely recommend reaching out actively. It can lead to both new users and valuable feedback.
What We Couldn't Achieve
Next, let's take a look at what didn't go so well.
-
Did not result in app installations or website traffic
As mentioned earlier, we saw a noticeable increase in views and impressions. However, those numbers didn't translate into app installations or visits to the website. Below, I'll break down the results by platform. The evaluation period is set from November 1, 2024, when the full-scale operations started, to March 17, 2025. The following data reflects the number of app installs measured by AppsFlyer during the period. Note: We've decided not to disclose the specific number of installations.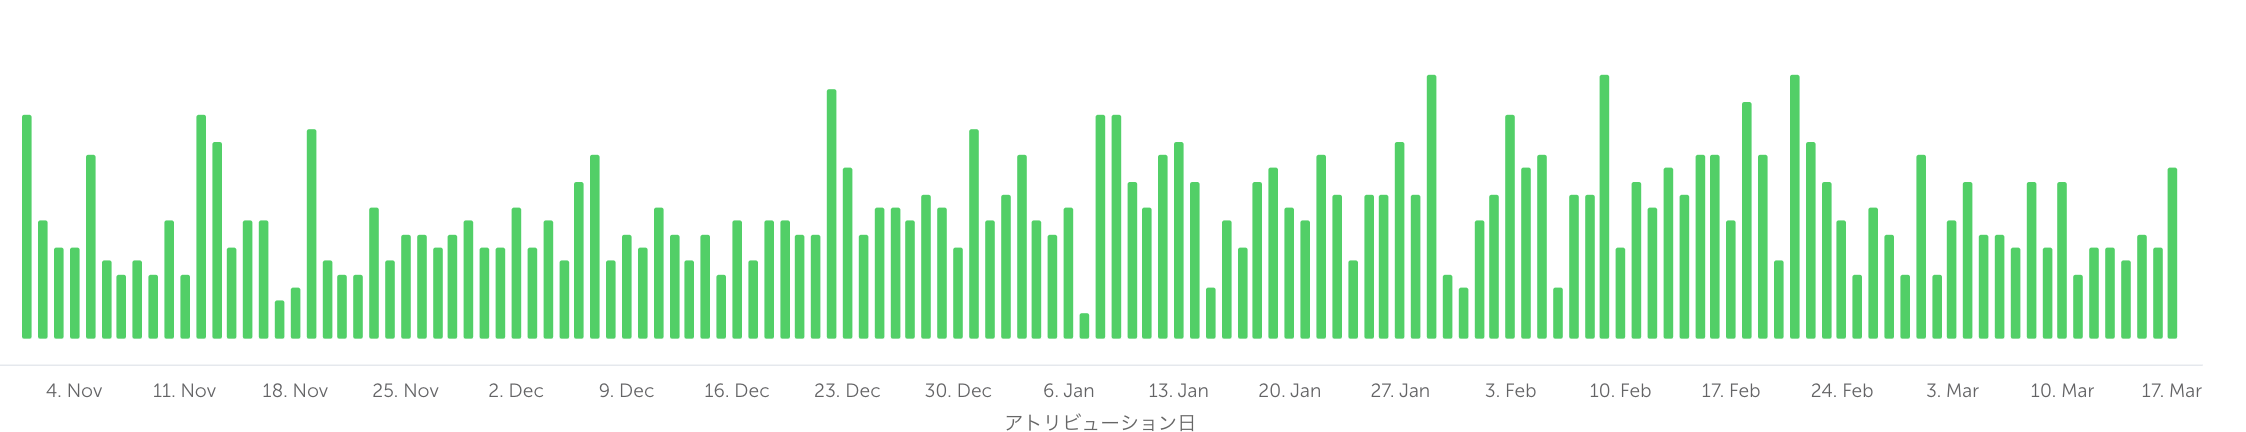
Tiktok & Number of app installs
First, we investigated whether there was any correlation between TikTok metrics and app install numbers.Number of views
This chart was shown earlier, but here we compared the number of TikTok views with the app installs. As you can see from a quick comparison of the graphs, there doesn't appear to be a clear correlation. For example, even though views peaked on January 2, 2025, there was no noticeable increase in installs. On the other hand, January 29, 2025 saw a spike in installs when there was no change in views. This also leads us to conclude that there is no correlation between TikTok views and app installs.Profile views
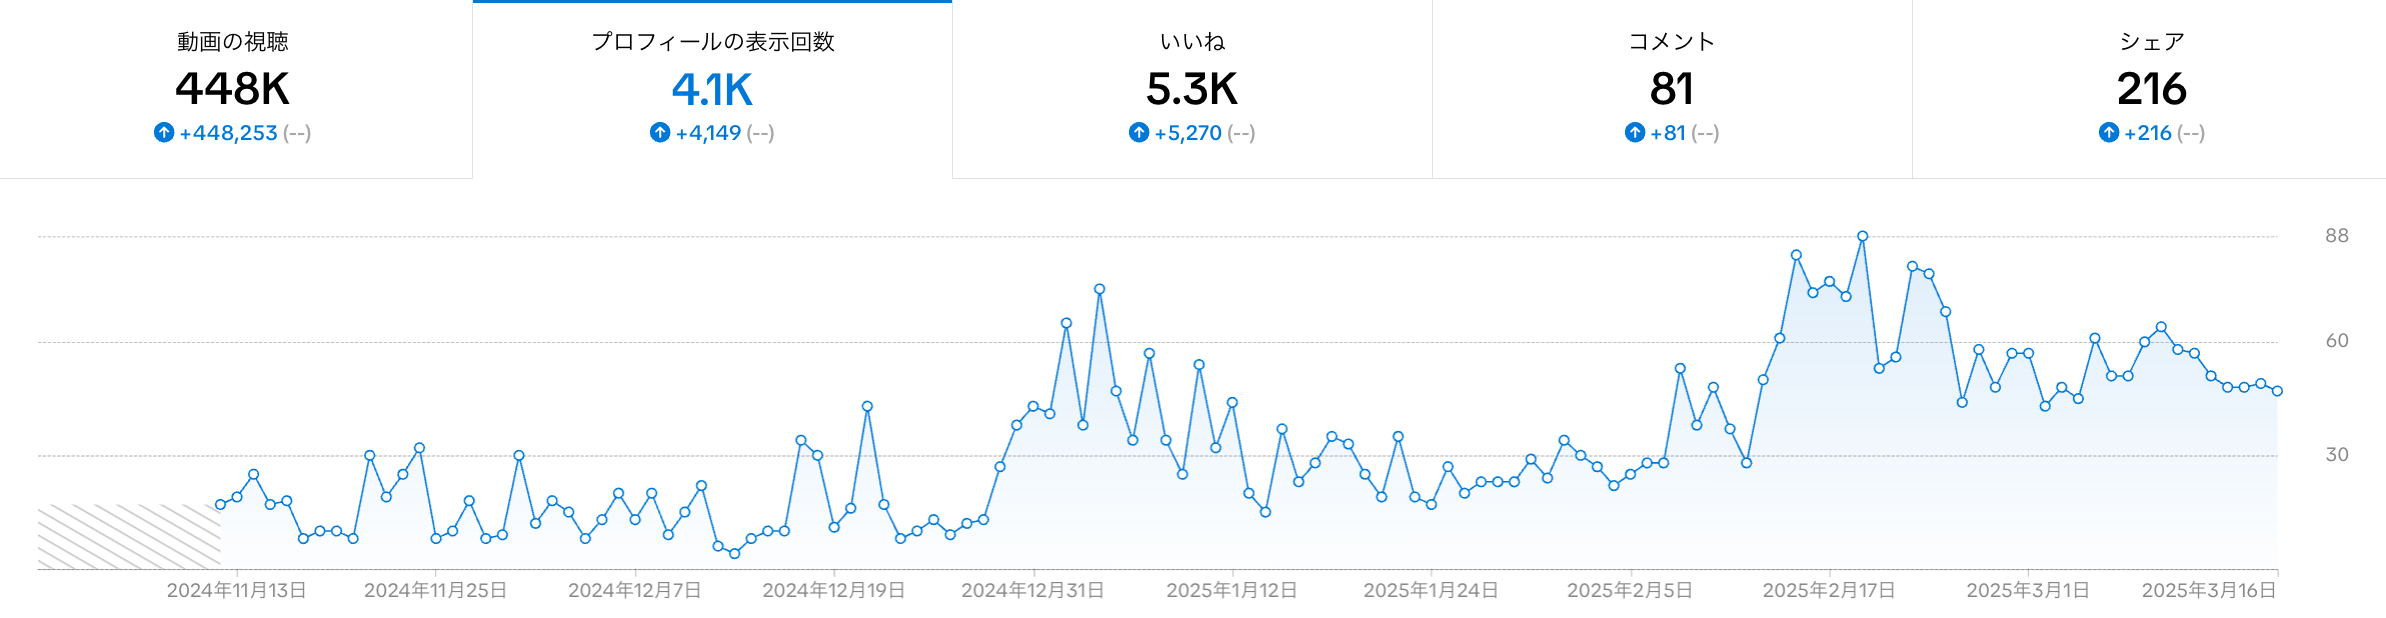
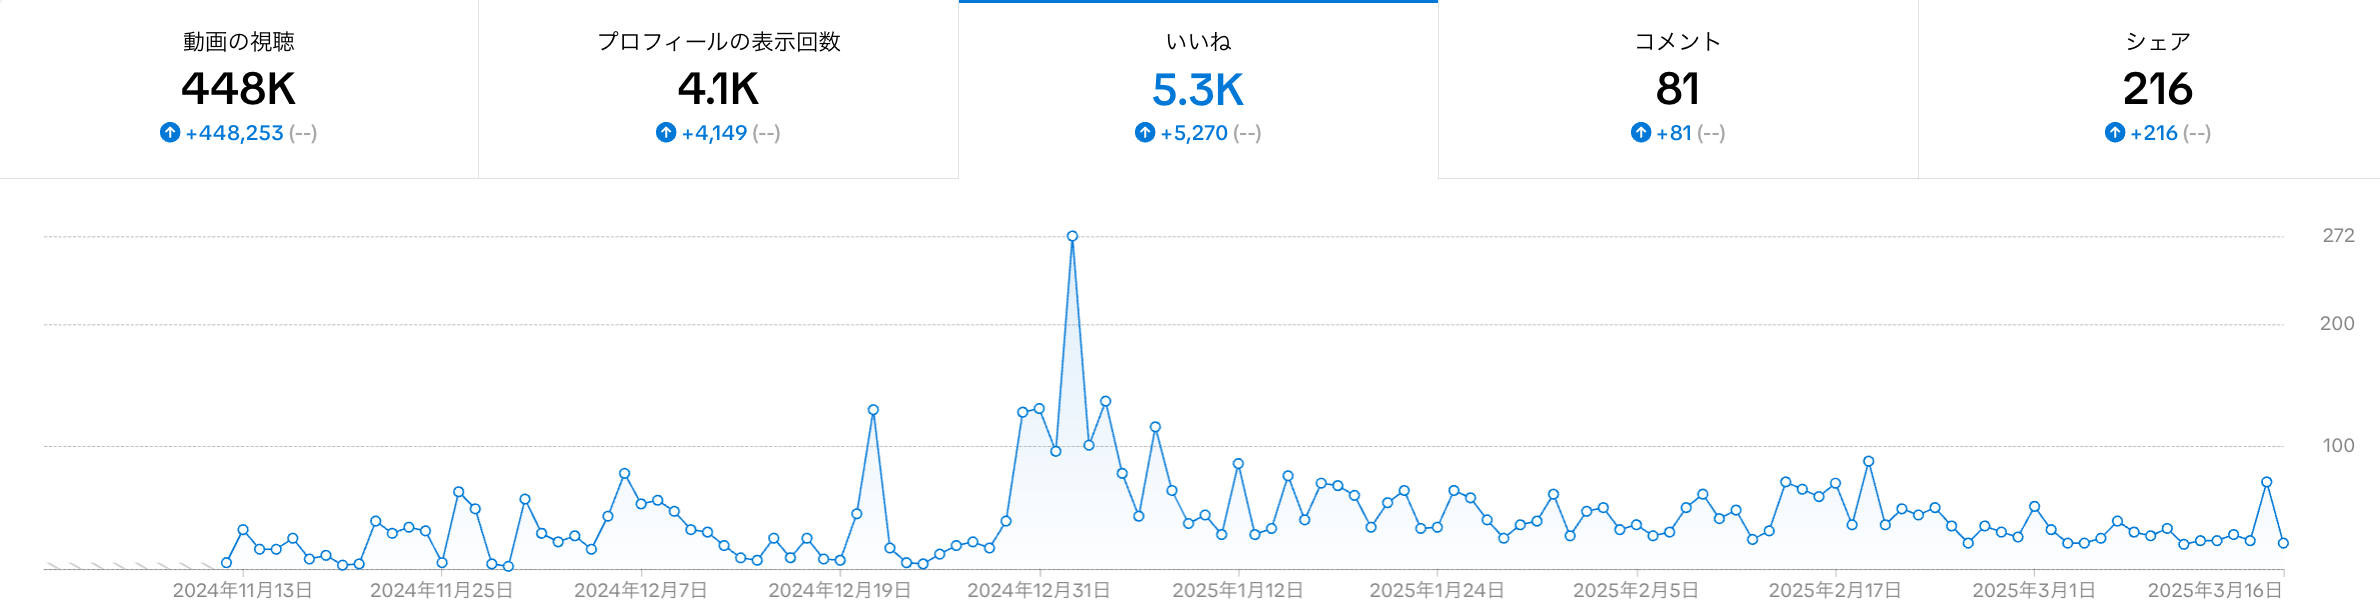
Next is the number of profile views. We assumed that users who visited our profile showed some level of interest. Thankfully, profile views have been trending upward, but for now, it doesn't seem like they're having much of an impact on app installs.Likes
What about the number of likes? At a glance, the trend in likes seemed to follow a similar pattern to views. Similarly, on January 2, 2025, when we got the highest number of likes, app installs didn't change. And on January 29, 2025, when installs spiked, likes didn't seem to contribute to that increase.Comments
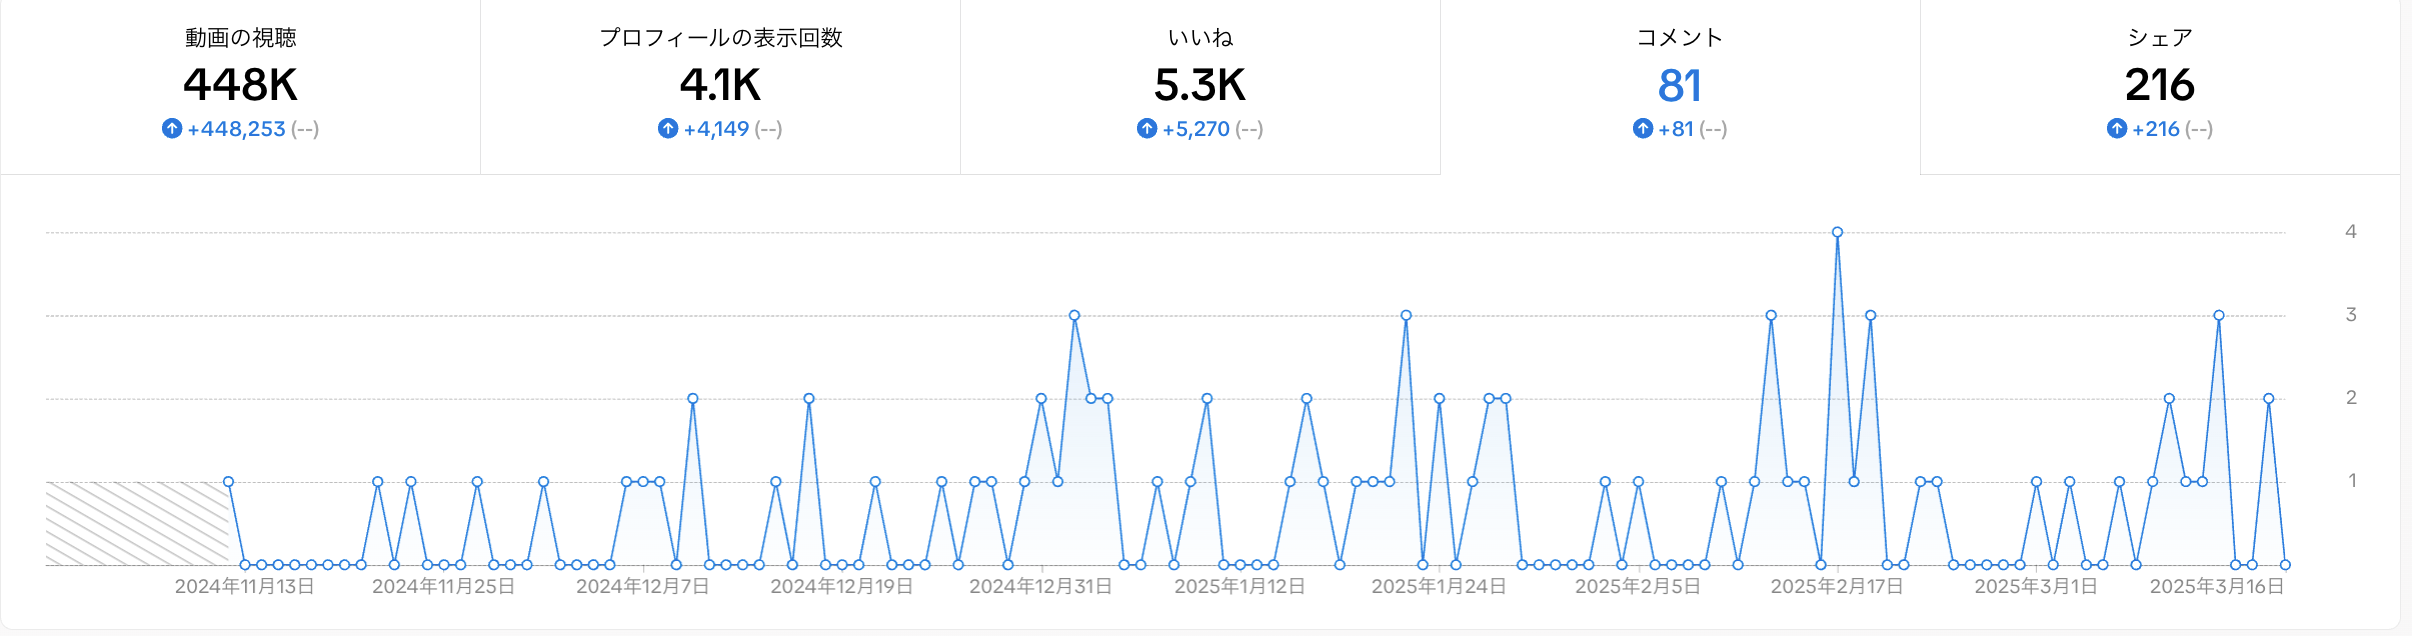
The total number of comments was 81, which is relatively low considering the number of views. There were even days with zero comments. The number of comments on February 17, 2025 was slightly higher at 4, but there was no change in installs.Shares
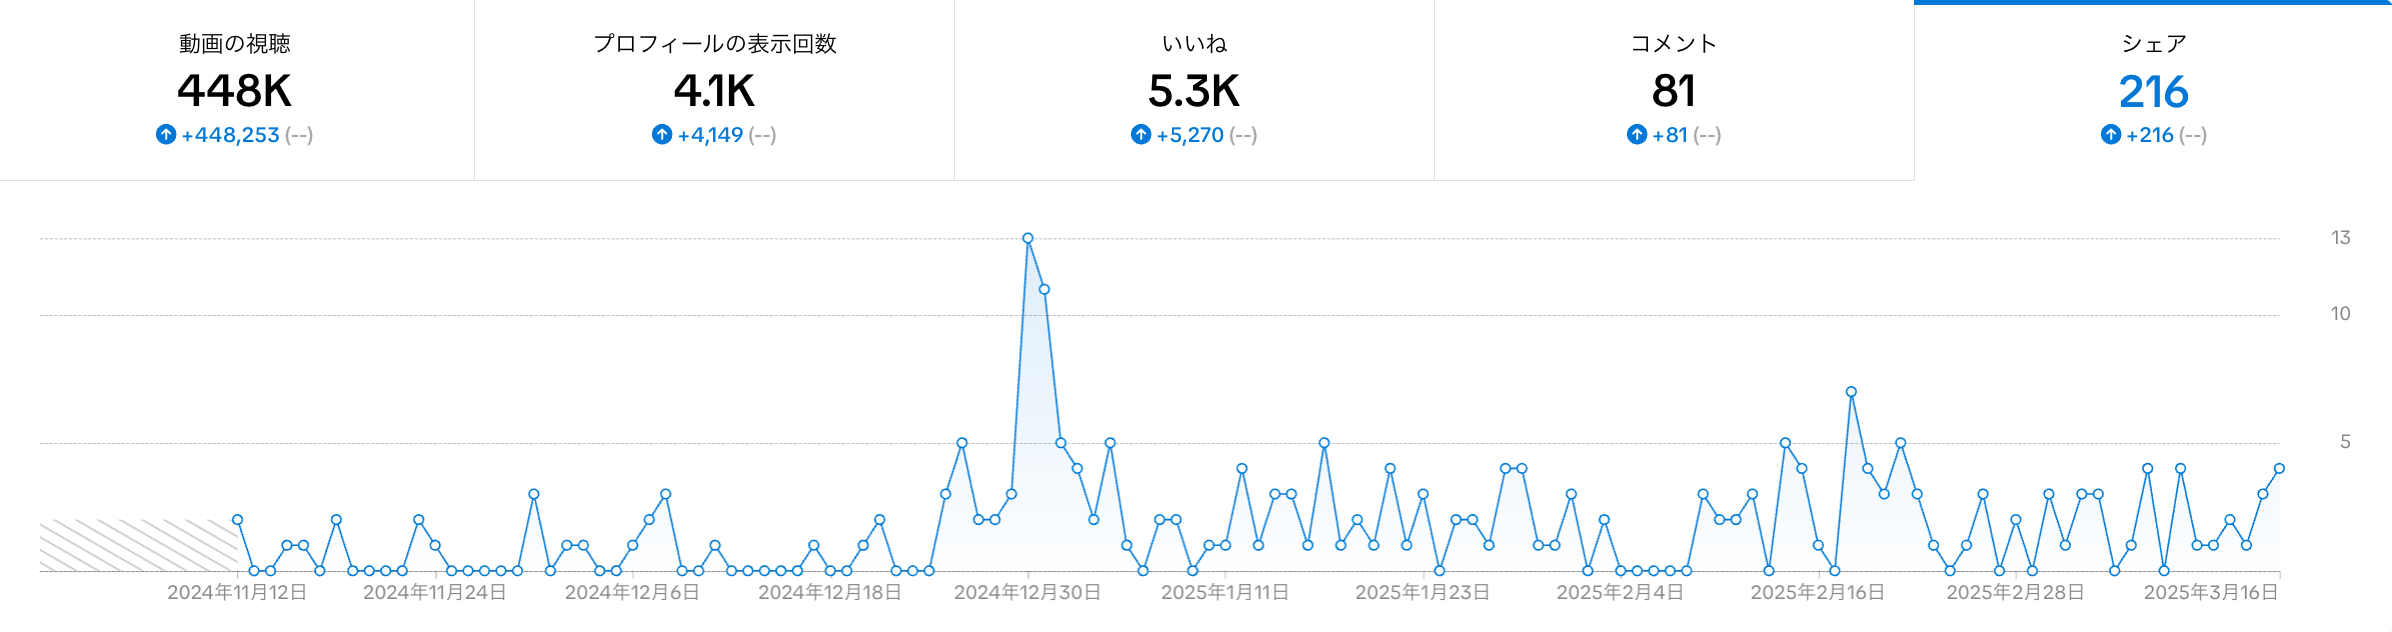
The trend in shares was also similar to that of views and likes. We noticed firsthand how TikTok's algorithm tends to promote videos that get a lot of likes and shares, placing them on the For You feed, which in turn helps boost views.Instagram & Number of app installs
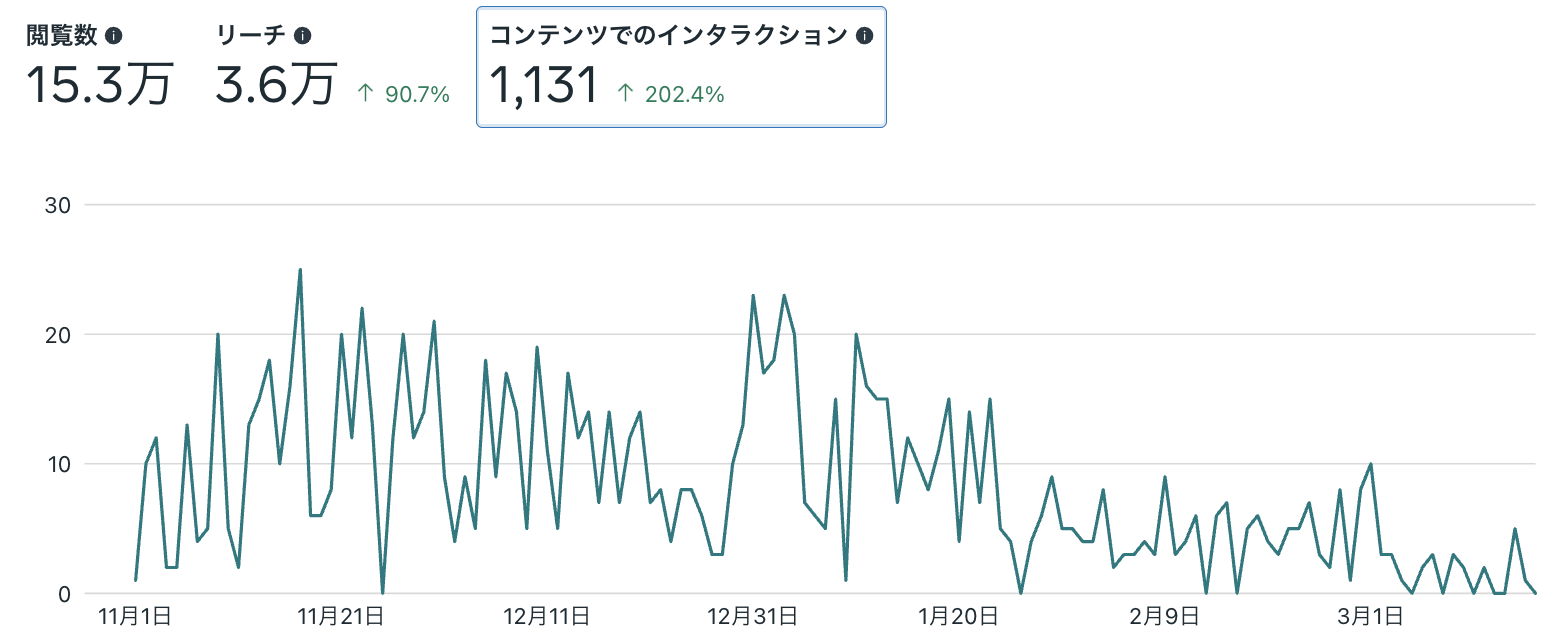
Next up is Instagram.Views
Similarly, large peaks around the New Year holiday. As mentioned earlier, that timing didn't lead to any noticeable change in app installs. On the other hand, there was some correlation over multiple days. Overall, the correlation wasn't strong, but compared to TikTok, there might be slightly more of a relationship between views and installs. Also, the reach (i.e. number of unique users) showed a similar trend as above, so I'll skip the details here.Interactions
Lastly, interaction. On Instagram, this includes likes, saves, comments, and shares. Again, no correlation was found with app installs.Summary Overall, there was no correlation between social media activity and app installs. So for now, it's hard to say that our social media efforts drove user acquisition. However, this analysis is based on correlation only, so it's possible that some viewers went on to install the app later. But to be honest, it's challenging to measure that accurately.
Traffic to the website
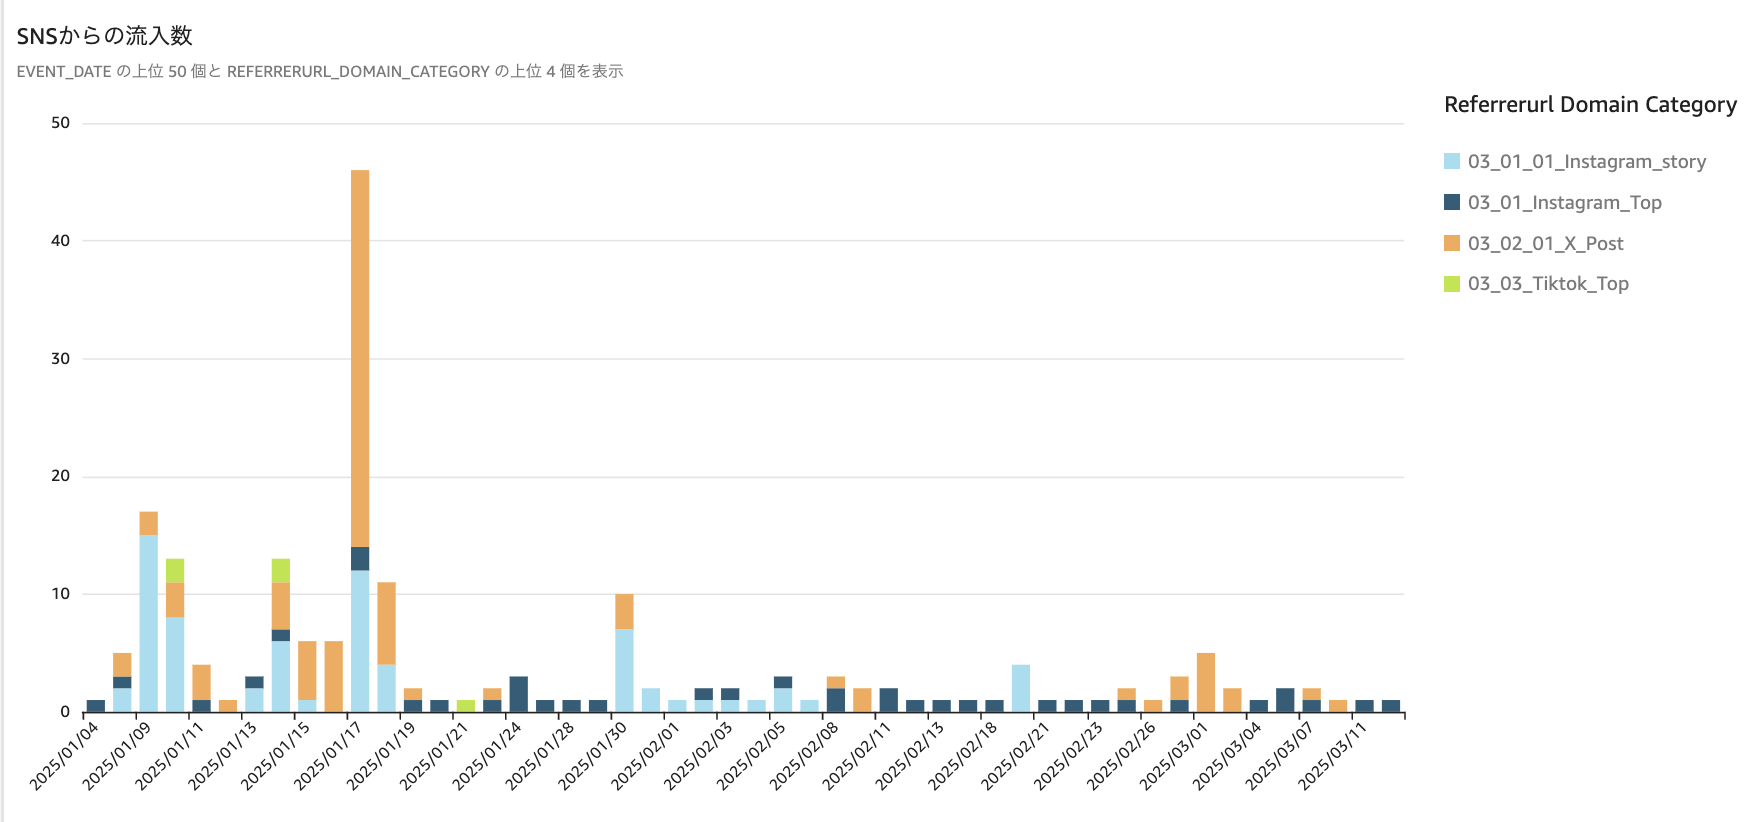
We expected that social media would also contribute to attracting customers as a route other than SEO. In reality, we were able to drive some visits through Instagram stories and posts on X, but the total number was only around 300, which is quite small. We believe this is mainly due to the low follower count on X which limited our reach, and the lack of Instagram story viewers. -
Impressions increased, but follower growth was limited
X: 425 followers
On X, we were still lacking in follows and actions such as likes. Part of the reason is that we took a slower, more cautious approach while juggling other platforms over a long period of time. I think it's best to be more proactive with follows and likes early on to gain traction faster. But be aware that excessive following can lead to shadowbans or account suspensions.Tiktok: 155 followers
Despite the high number of views, we barely gained any followers. I think there are two main reasons for this: One is that the content was too generic. I think it lacked originality and creativity. There wasn't anything that made users feel they had to follow the account or risk missing out. Second, the target was unclear due to the nature of Prism Japan targeting a wide range of people who are interested in travel. But on TikTok, we didn't narrow down the demographic (age, gender), so information ended up reaching a wide range of people.Instagram: 6,667 followers
At first glance, this number may seem high, but since we stopped running ads, follower growth has been on the decline. It's often said that followers gained through ads tend to be less engaged. On top of that, our post style shifted significantly after we paused the ads, which may have further accelerated the drop-off in engagement.
Key Characteristics & Improvement Points by Platform
Here, I'll break down the strengths of each platform and post performances we observed during actual operations.
-
TikTok: Content can go viral even without a large number of followers
Top-performing post: 3 hidden spots in Tokyo perfect for a girls' trip!
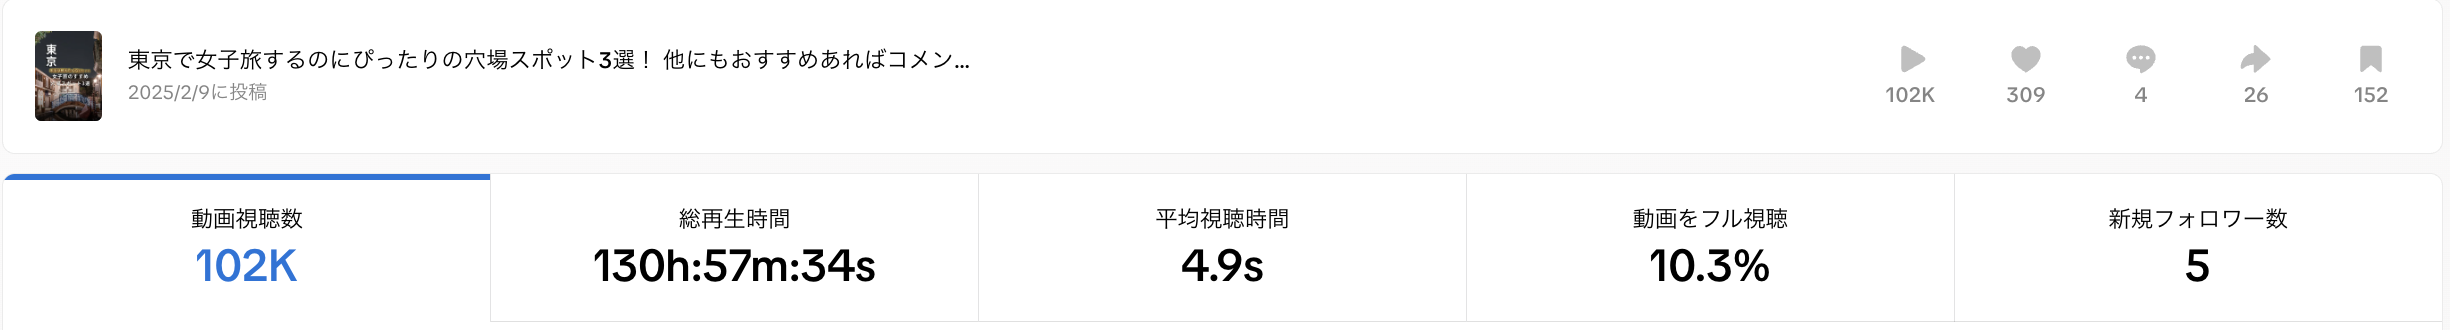
We intentionally set a very specific target audience for this post: "Girls traveling around Tokyo." This content guides users through the actual process of using the app to discover hidden gems. The spots featured are hidden gems with themes like "overseas-inpired," "anime-related," and "en-musubi (shrines dedicated to love and relationships)." As a result, 94% of traffic came from search, with queries like "Tokyo places to hang out for two girls" or "Tokyo sightseeing." We believe narrowing the target and showcasing true hidden spots played a key role in its success.Lowest-performing post: The Hibiya illuminations were so beautiful!
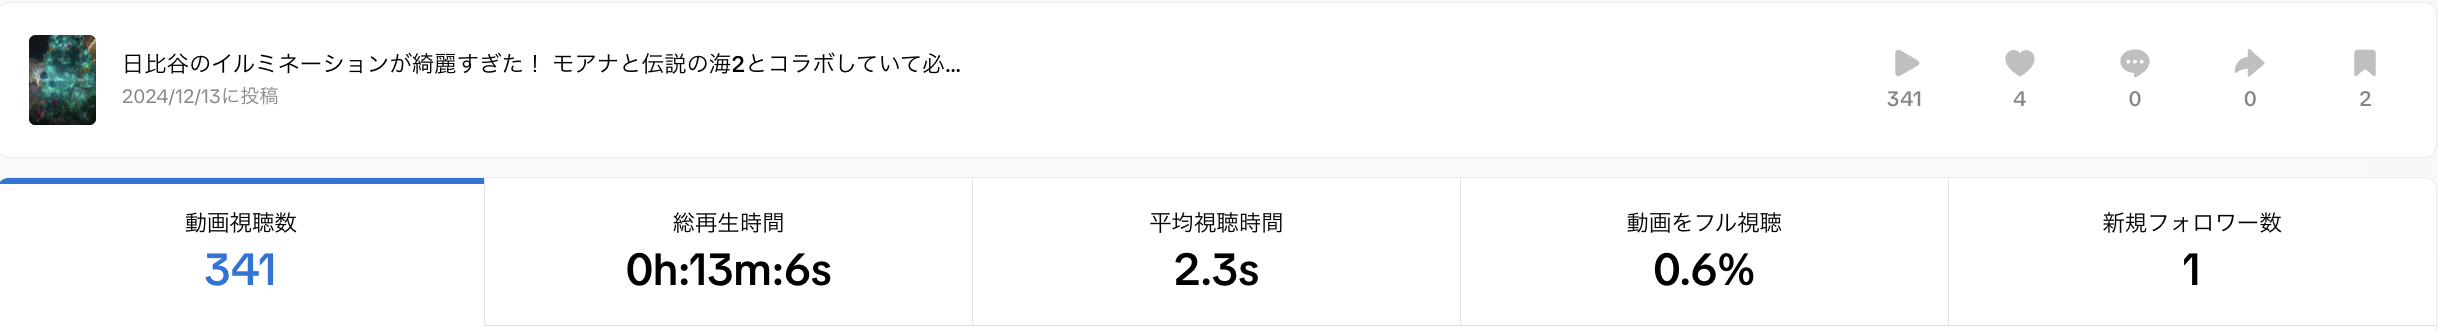
The video that didn't perform well was the one about the Hibiya illuminations. We actually visited the location, captured the lights and ambiance, and tried to create an engaging video by syncing with the background music. Despite these efforts, the video barely got any views. The likely reason is we entered a highly competitive area filled with high-quality content under popular keywords like "Christmas" and "illuminations," making it hard to stand out.Summary
Comparing the two, we found that the successful post had a clear target audience and offered useful content to that audience. As a result, the number of views increased significantly, along with key metrics like average watch time and completion rate. -
X: Communication with users is its strength
Top-performing post: 4 recommended shrines and temples for autumn foliage
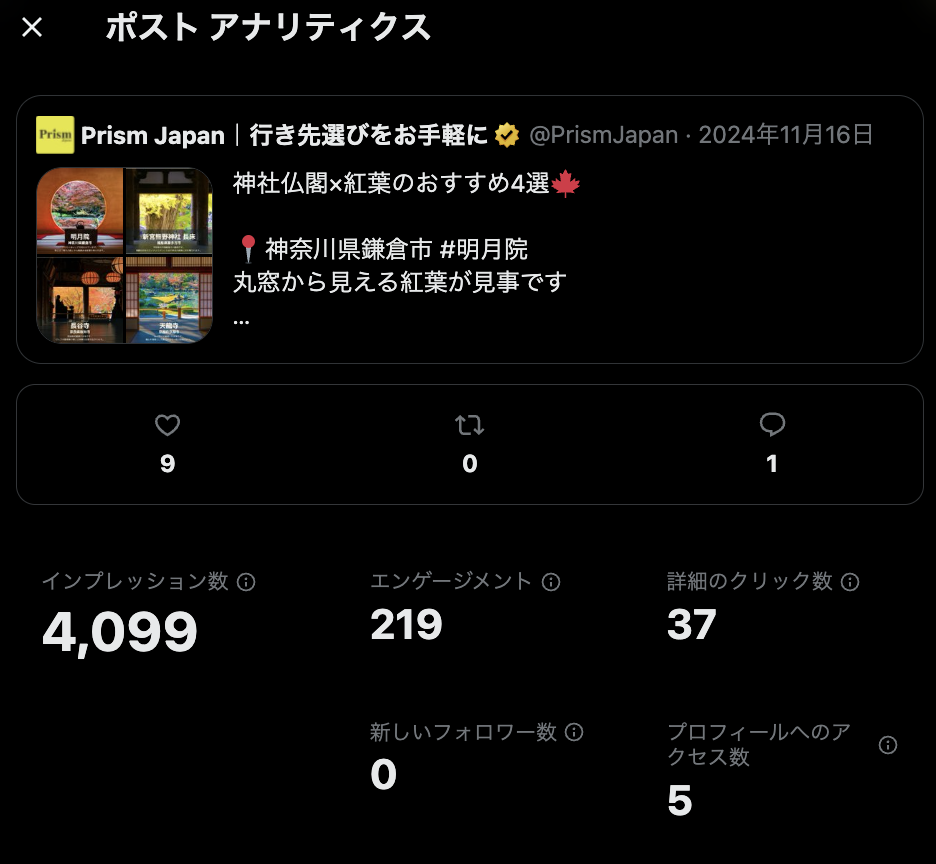
This post highlighted a selection of spots where you can enjoy the beautiful combination of autumn leaves and traditional shrines or temples. It includes location details for each spot, highlights, and accompanying images.Lowest-performing post: Today is Christmas!
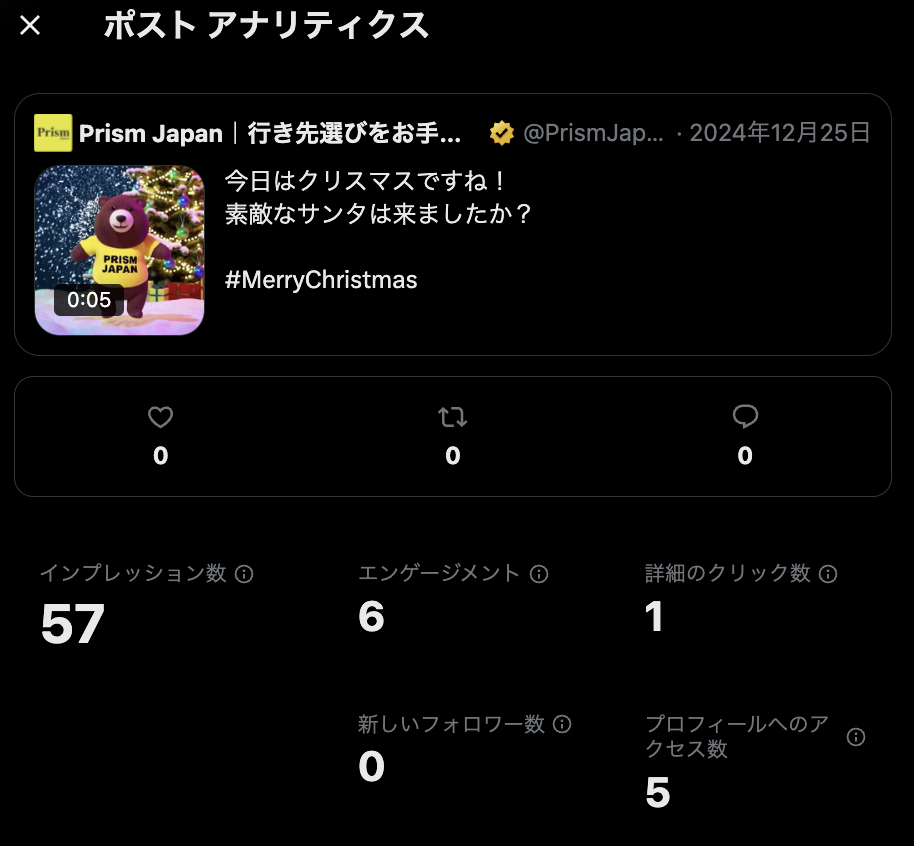
This post featured a video created using generative AI, accompanied by the trending hashtag #MerryChristmas. The goal was to bring a more "human" feel to the account and to gain some impressions with the hashtag but the post didn't generate much engagement.Summary
Looking across other popular posts on X, content that ties into seasonal themes or current trends tends to perform better. I also found that useful content, whether it's well-organized or clearly valuable to the viewer, plays a key role in performance. -
Instagram: Short videos make it easier to reach non-followers
Top-performing post: [2024-2025 Season] 4 recommended ski resorts near Tokyo
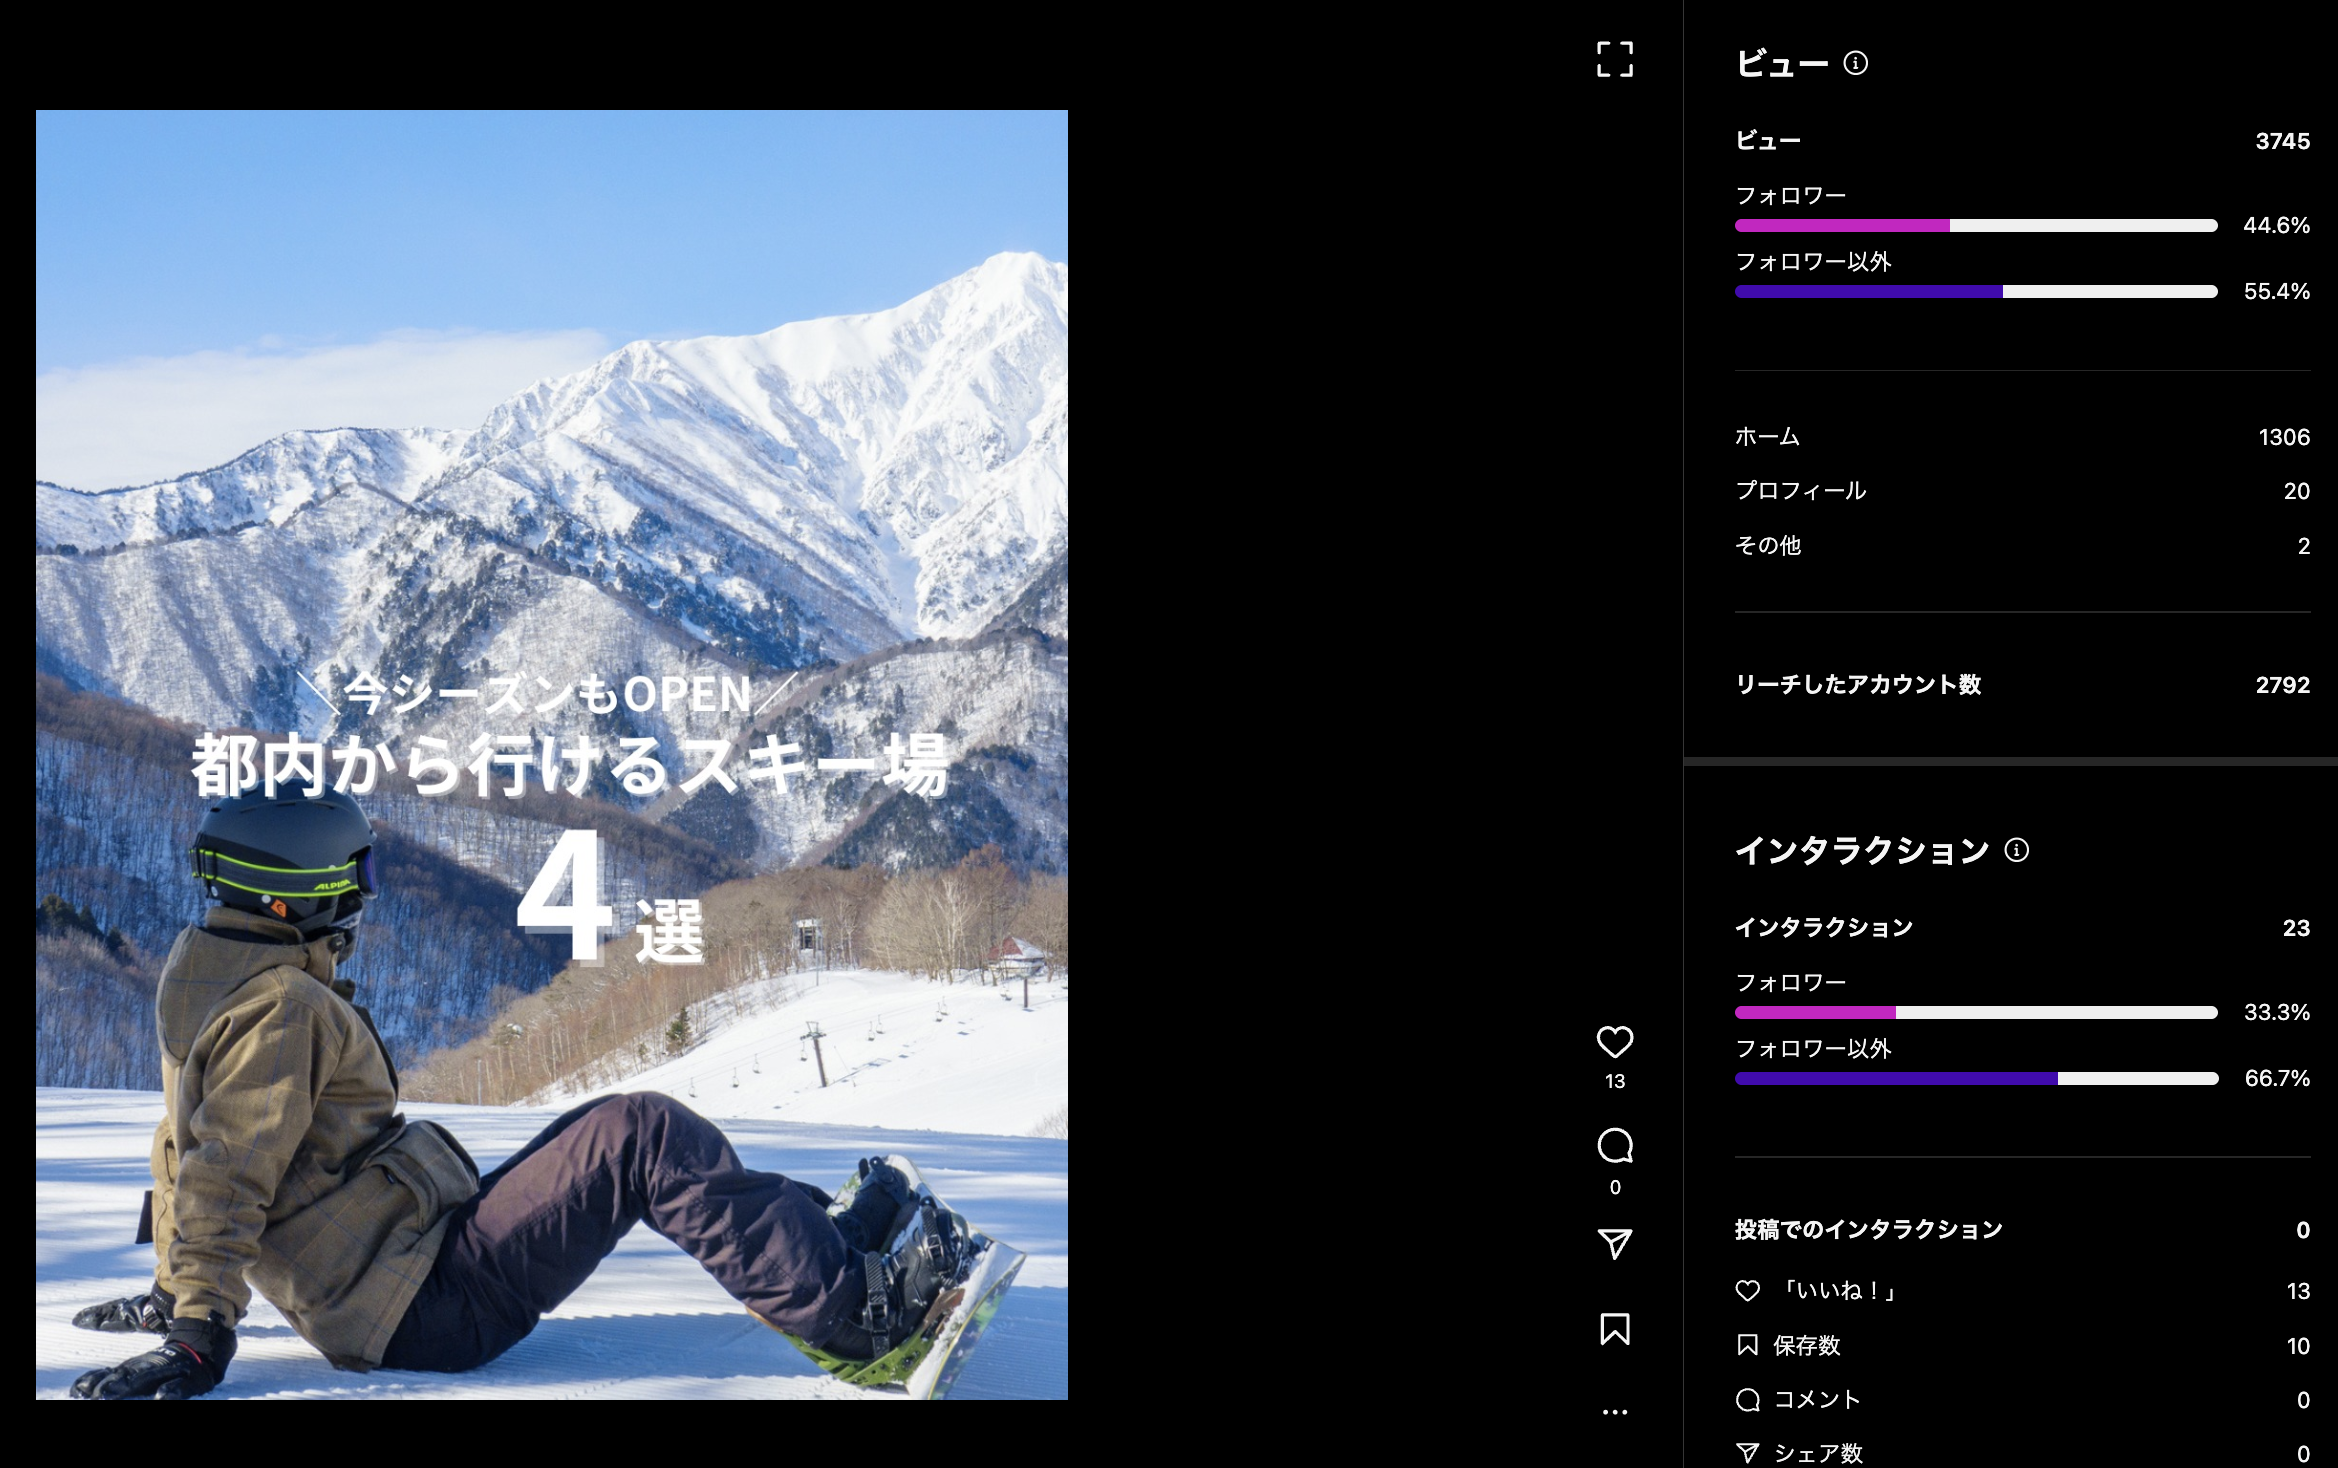
With the start of the winter ski season, we introduced ski resorts around the Kanto area using an image post. We listed the opening periods, hours, and pricing for each resort. As a result, the post received 10 saves, which was noticeably higher than other posts, and it reached 55.4% non-followers. In my opinion, Reels tend to reach non-followers even without many saves, while image posts usually stay within your followers, around 90 percent of the time. Looking back, I realized that creating posts people want to "save" is the most important.Lowest-performing post: AI diagnoses you!
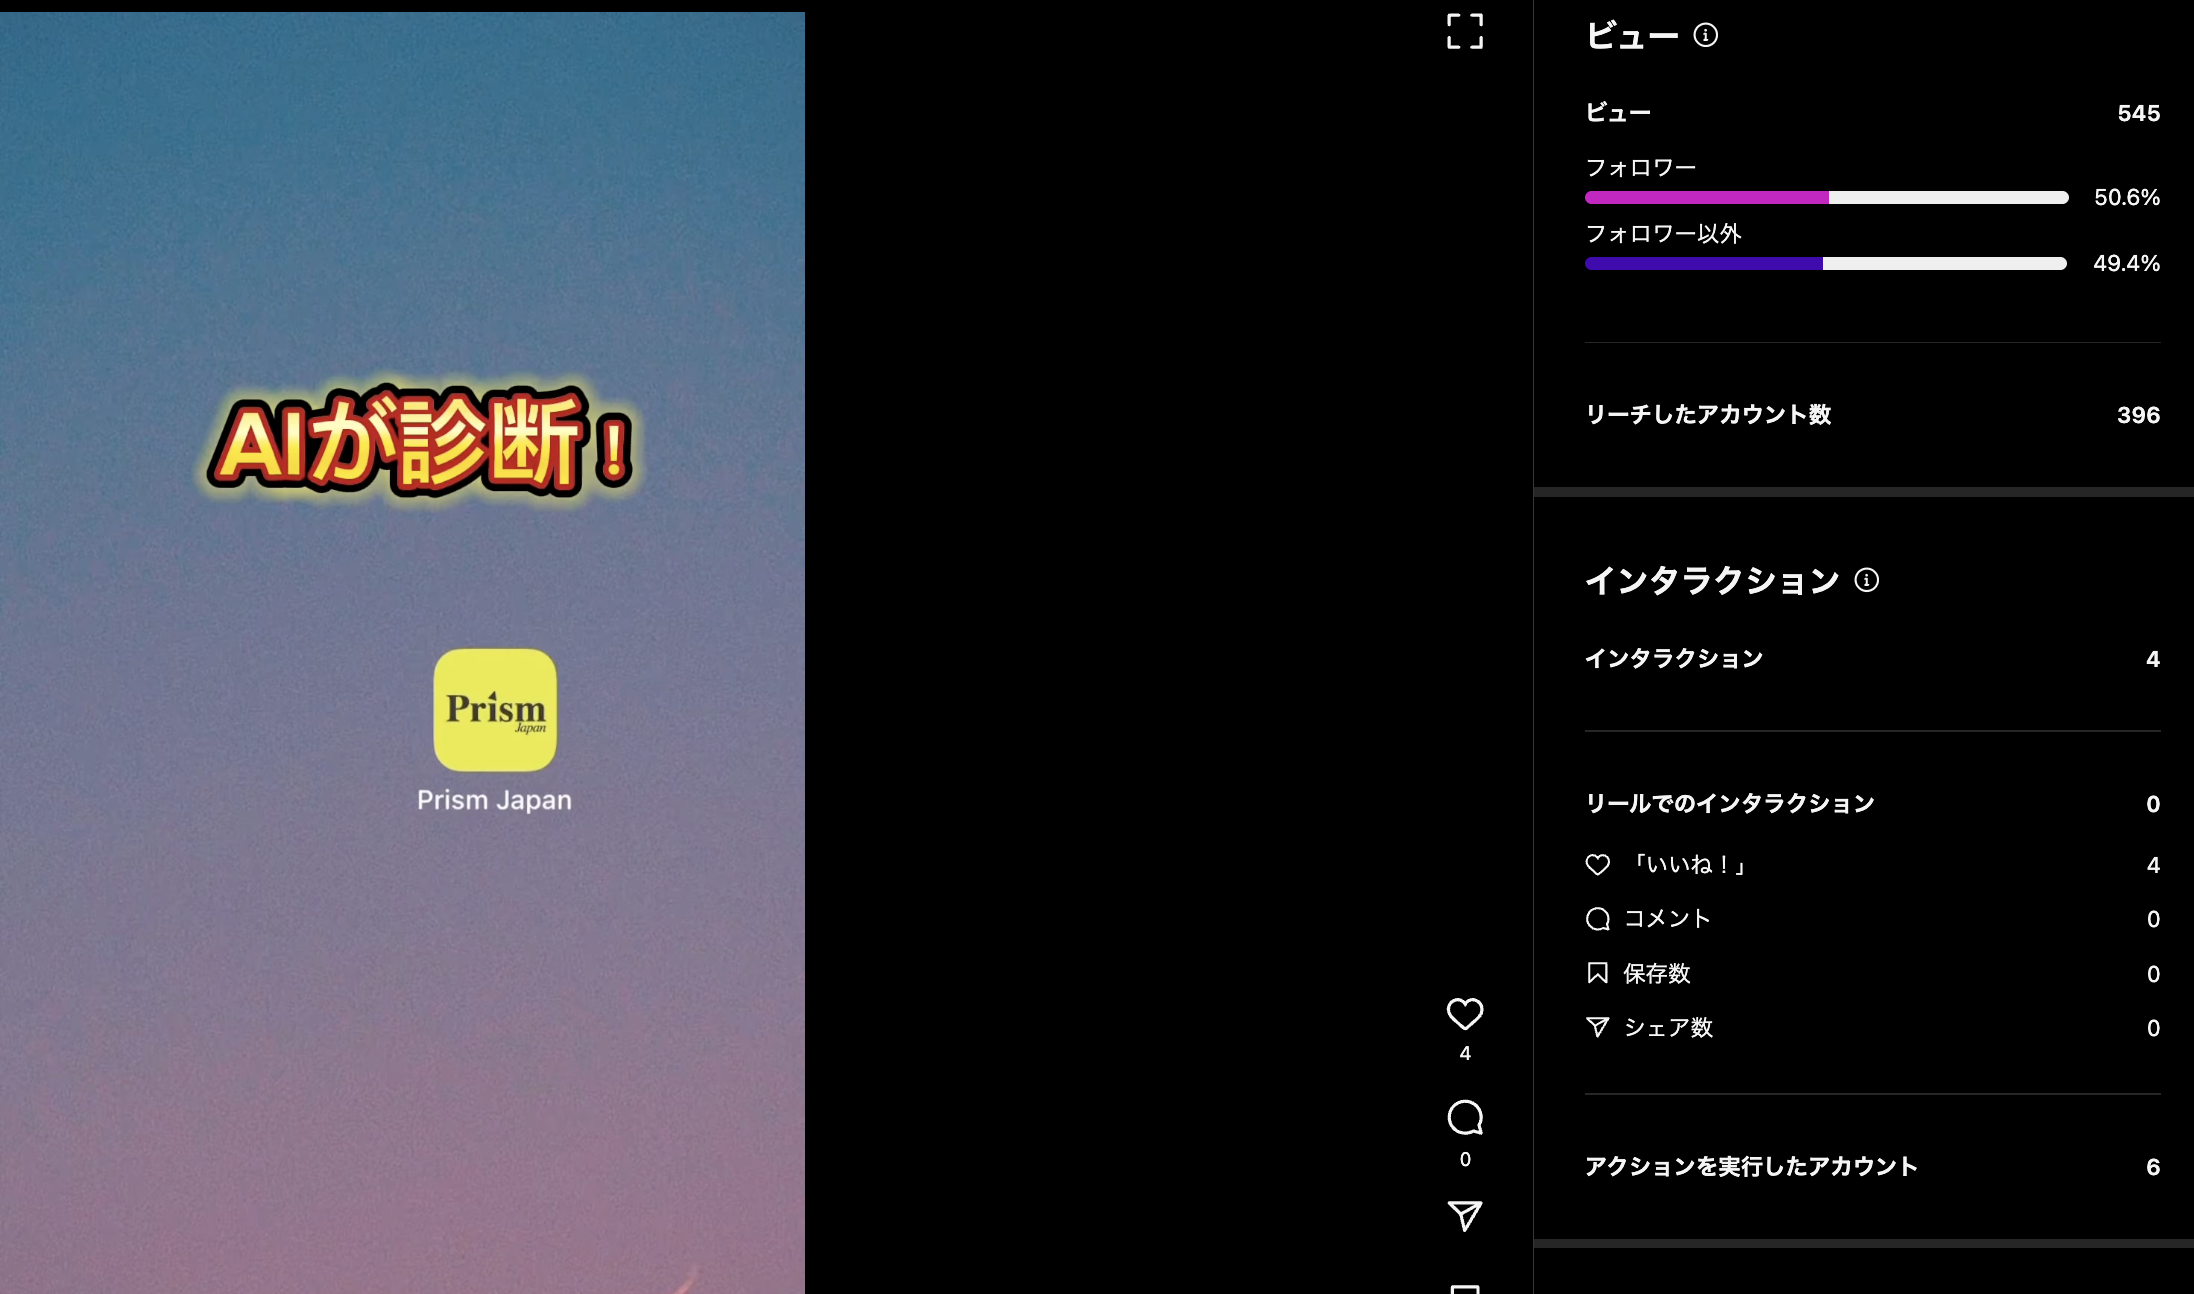
In contrast, this video introduced our app's "Search by mood" feature using a Reel. The intention was to have users recall how they would use the app by recording the actual app screen and walked through the steps, but it ended up being the least played video. I think the target audience wasn't clearly defined, and the value to the user wasn't communicated well.Summary
While Reels and image posts differ in how easily they reach non-followers, I got the impression that a post's performance often depends on whether it gets saved. More than just offering useful content, it's important to actively encourage saves and review it regularly.
Overall Summary & Future Direction
Overall, we found that social media didn't make a major contribution to attracting customers. That said, we can't say no effect either. So, we'll continue to reflect and refine our approach moving forward. This article highlights two particularly important points:
- Clarify your target
- Information that is useful to viewers
These may sound obvious, but I realized that these two points are essential for videos to driving performance regardless of the platform. We also used the same content from TikTok on Instagram, but because the user demographics differ between platforms, it didn't get much of a response. While it's ideal to tailor posts for each platform, our limited resources made it difficult to do so effectively. Each platform has its own unique characteristics and user demographics, so it’s important to identify what works best based on the specific purpose.
References
関連記事 | Related Posts

We are hiring!
【PdM】オープンポジション/東京・名古屋・大阪
募集背景KINTOテクノロジーズでは新たな事業展開と共に開発するプロダクトが拡大しています。サービスの新規立ち上げ、立ち上げたプロダクトのグロースを推進し、KINTOの事業展開を支えるプロダクトマネージャーを求めています。
【オープンポジション】「気になる!」方はまずはこちらからご応募ください。/東京・名古屋・大阪・福岡
業務内容国内外のKINTOサービスや、トヨタグループの金融、モビリティサービスの内製開発組織である同社にて、ご経験・ご志向性に応じて配属を決定し、ご活躍いただきます。