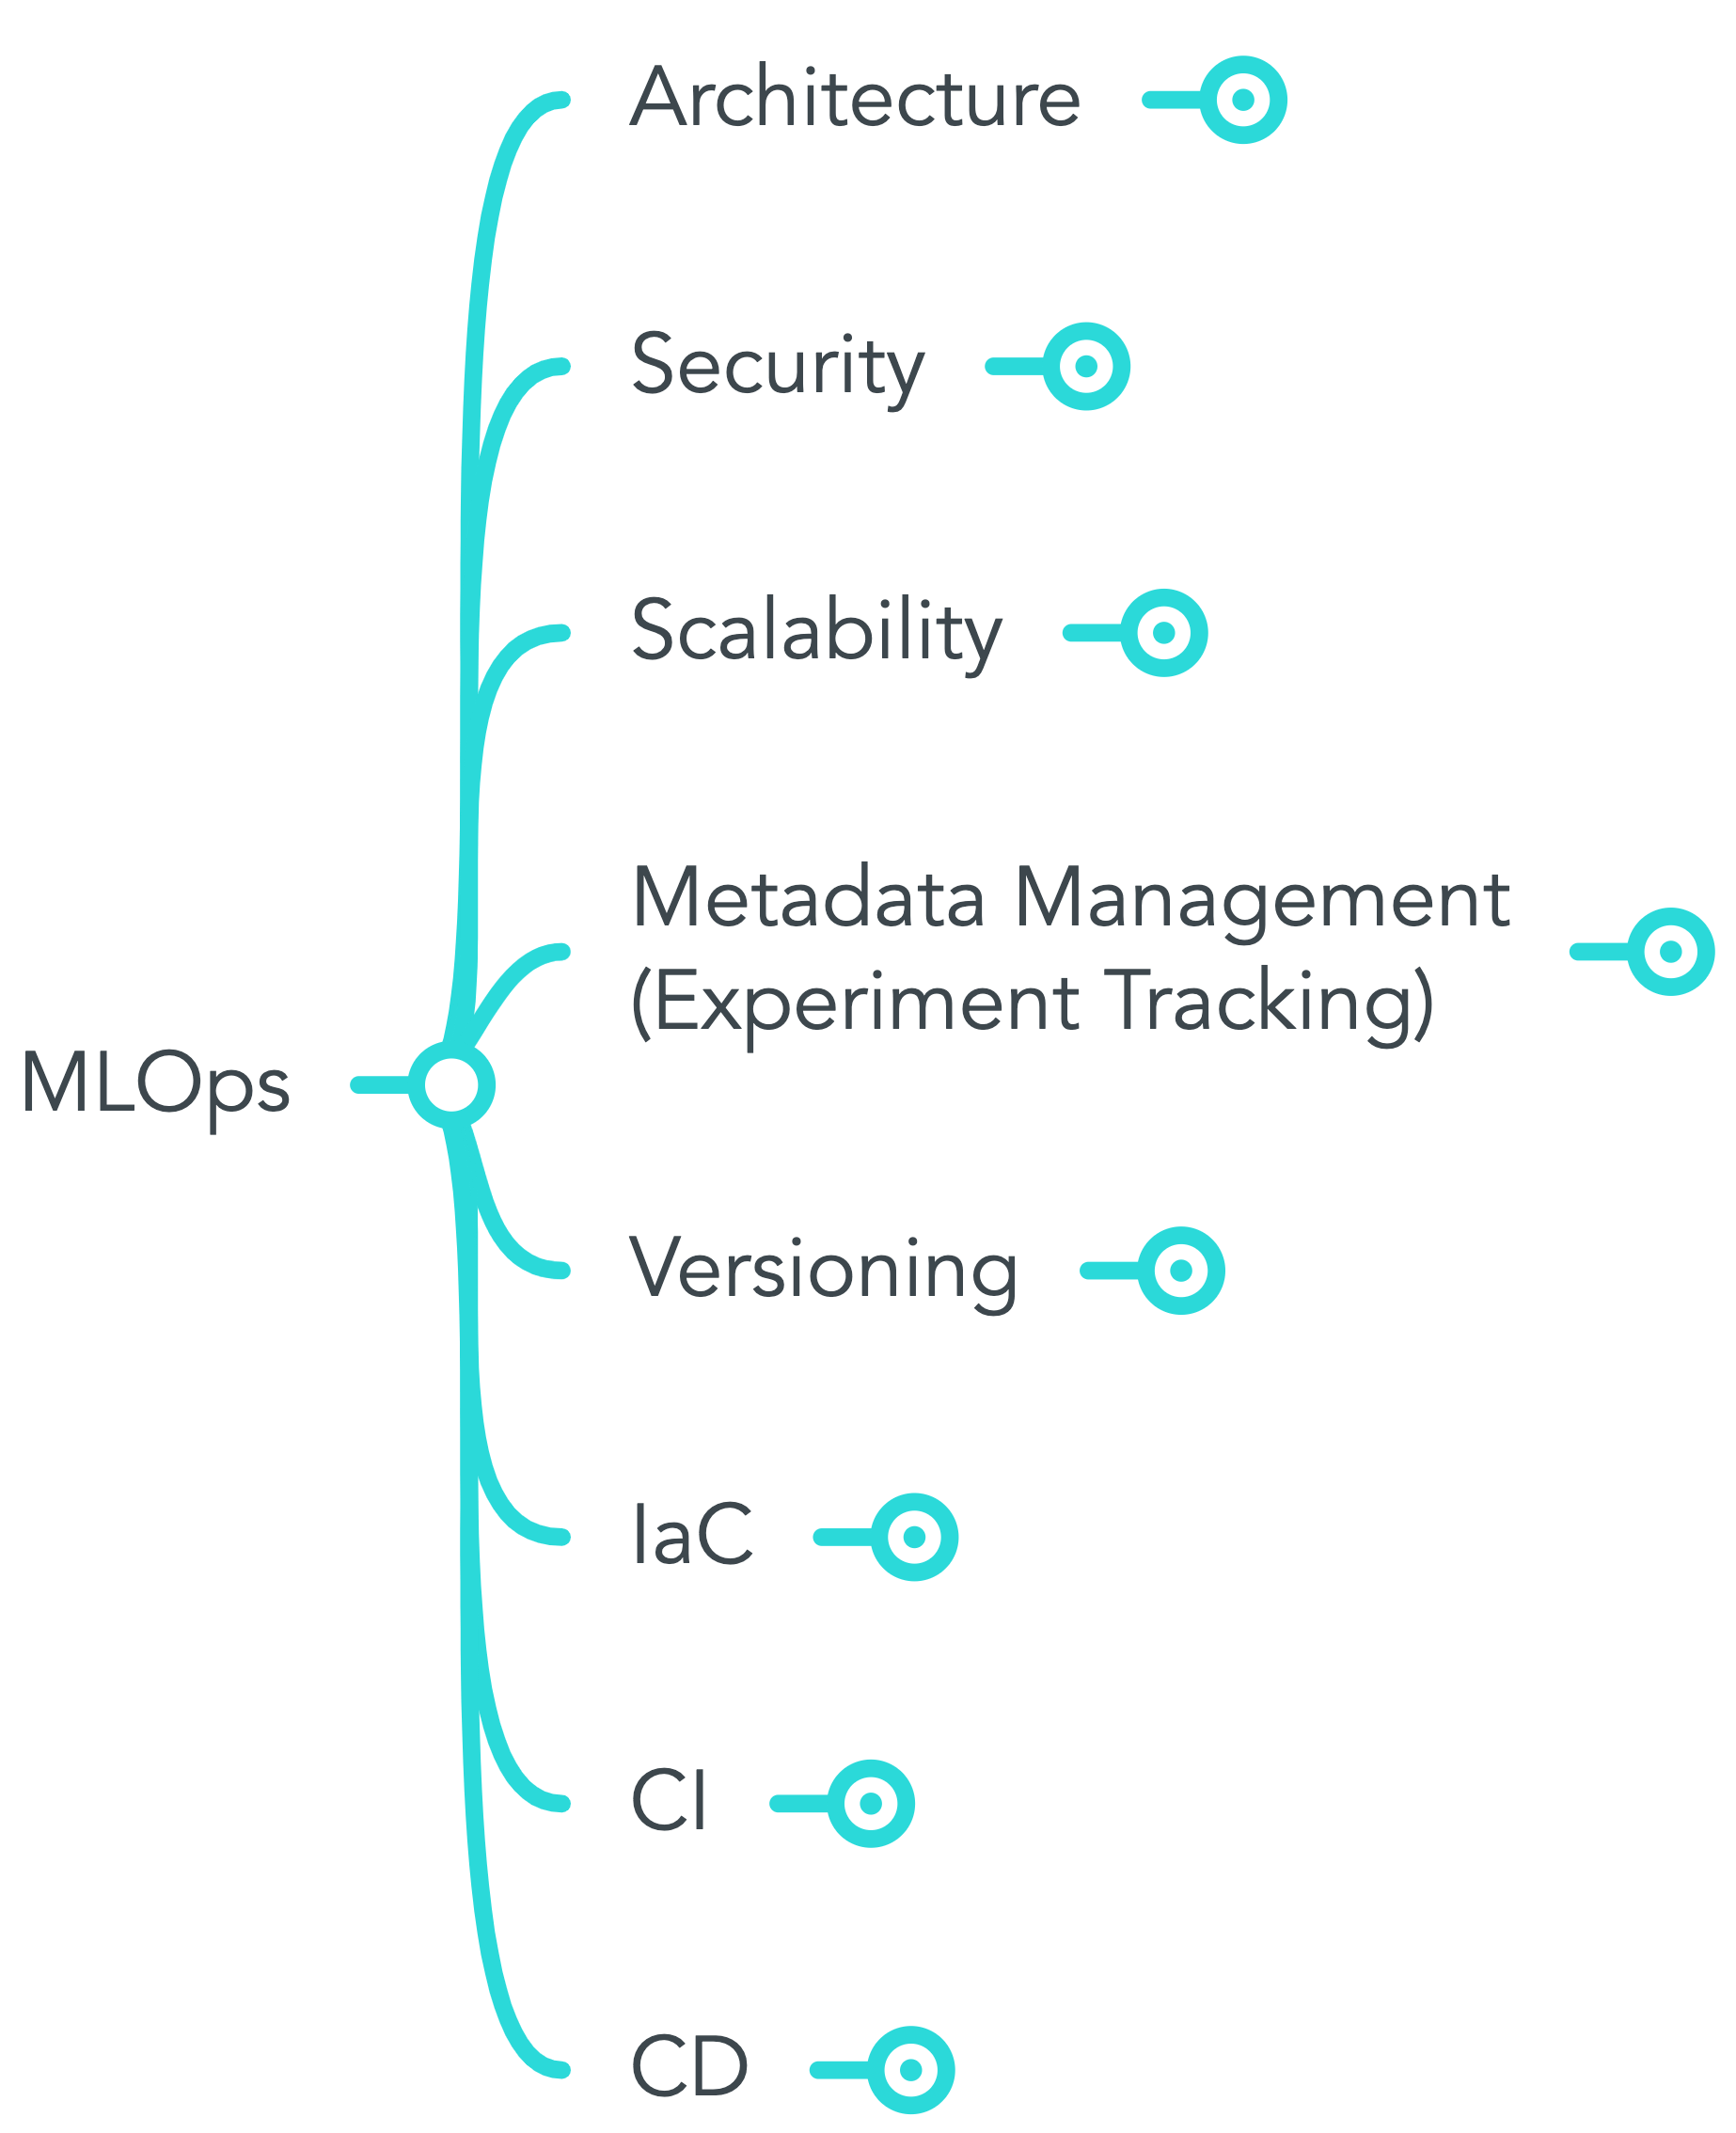
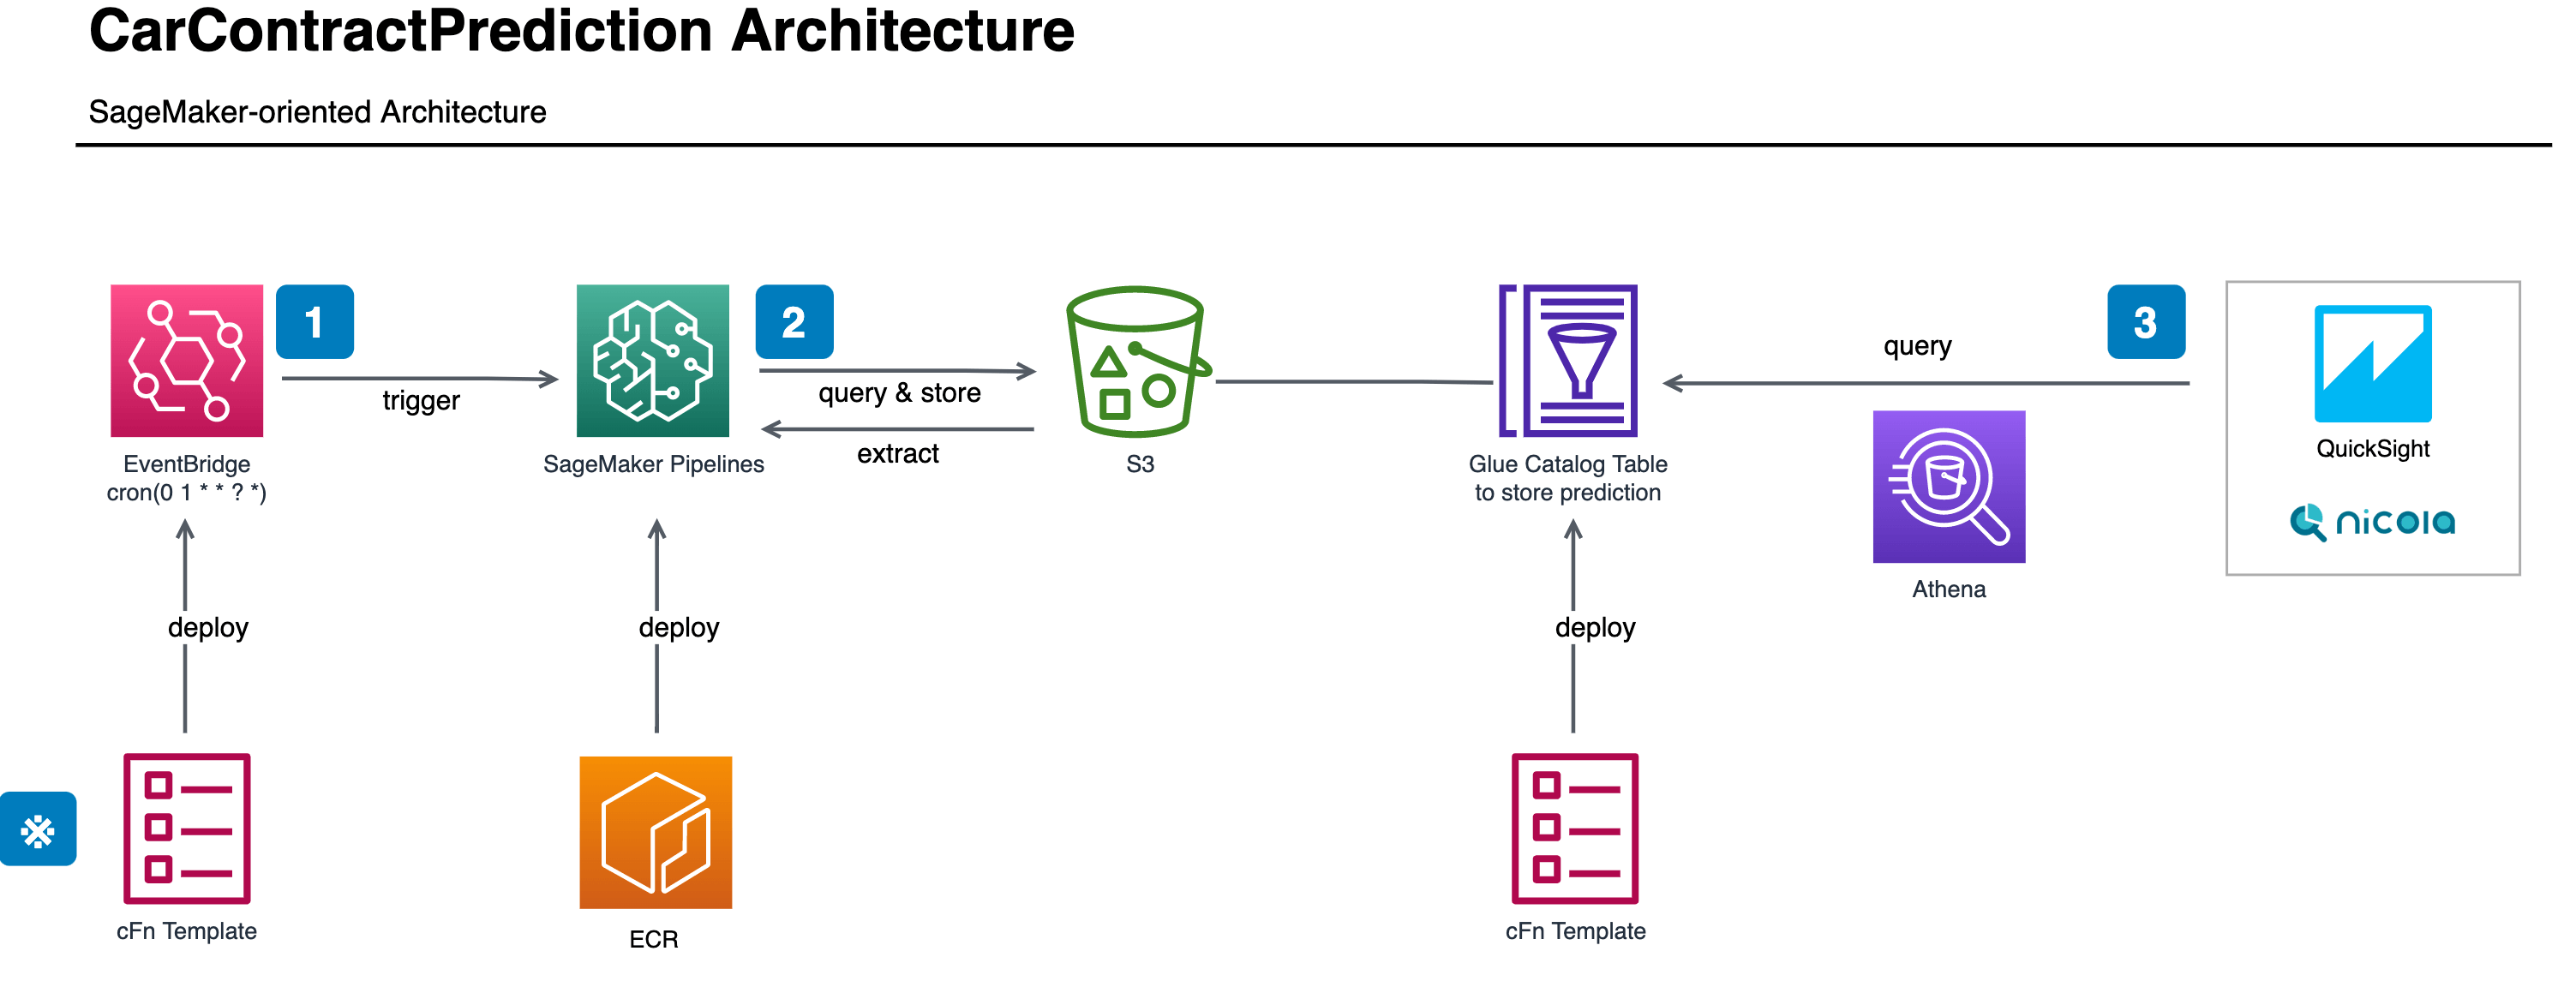
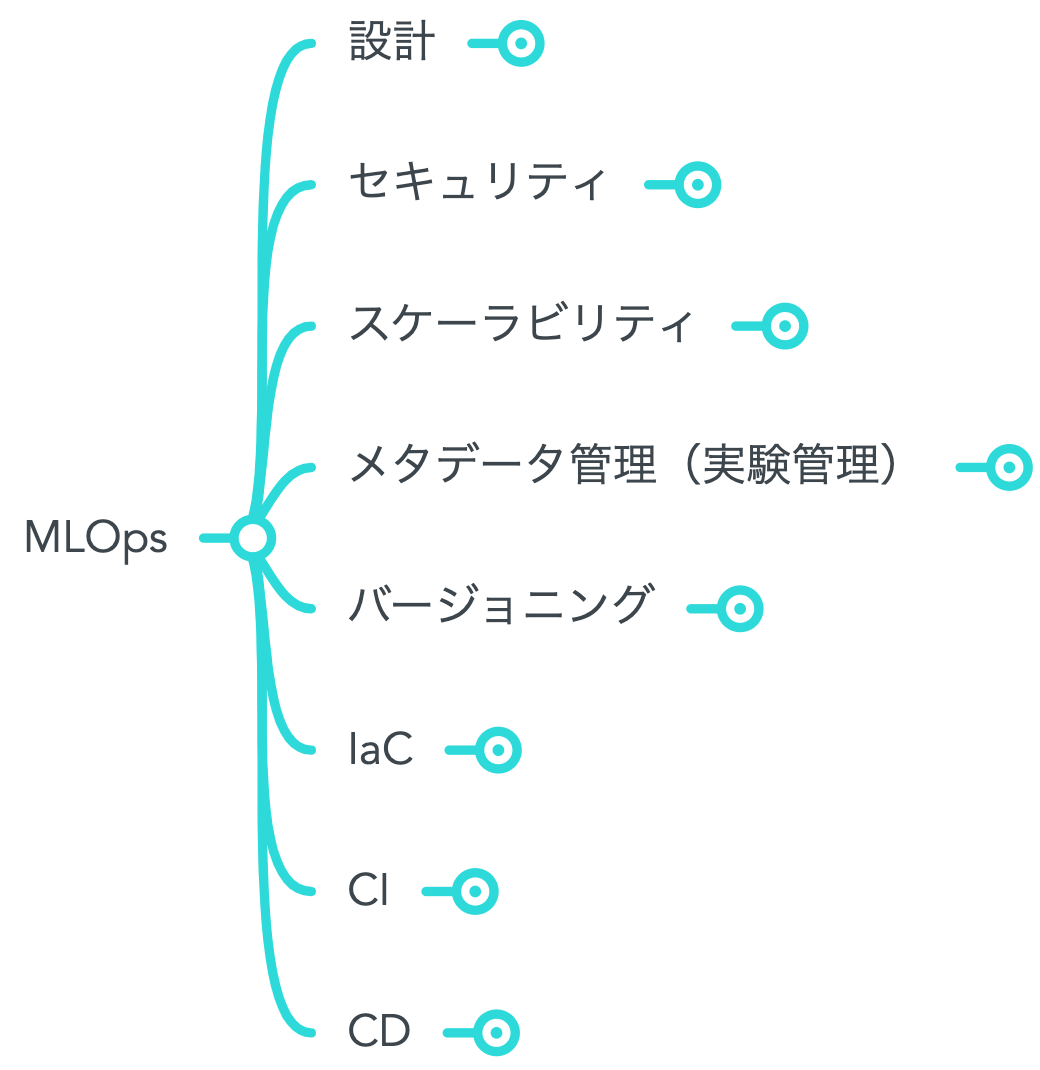
SageMakerExperimentsを用いた実験管理 (3/4)

こんにちは。分析グループ(分析G)でMLOps/データエンジニアしてます伊ヶ崎(@_ikki02)です。
こちらは「KINTOテクノロジーズ株式会社にてどのようにMLOpsを適用していくのか」というテーマでの連載3本目です。1本目の記事「KINTOテクノロジーズのMLOpsを定義してみた」および2本目の記事「SageMakerを使った学習&推論のバッチパターン」はそれぞれのリンクよりご確認ください。次回最終回となる記事では、他部署も巻き込んで開催した勉強会のお話を予定しています。
背景(Situation)
連載1本目にて「メタデータ管理(実験管理)」がなぜ必要なのか一般的な背景を記載しました。この記事ではKINTOテクノロジーズでの状況をより深掘りして見ていきたいと思います。
KINTOという会社およびサービスがトヨタグループで立上がってから4年目というまだまだ若いこともあって、ビジネスサイドとデータサイエンスサイドの関係性構築が求められていました。立上げ期特有のスピード感においては、コードの品質や文書化などの管理コストを多少犠牲にしてでも、迅速なアウトプットが重要であり、価値検証に比重が置かれます。
サービスの立上げ期においてこのアプローチは悪くないですが、順調にサービスも伸びてきて人も増えてくると、今度は管理コストの重要性が相対的に増してきます。特にデータサイエンスという分野は、組織的に管理するための方法論がソフトウェア開発のそれに比べるとまだまだ成熟していないと個人的に感じており、ブラックボックスになりがちです。そのため、データサイエンスプロジェクトの管理について方法論を模索し始めたフェーズでもありました。
業務(Task)
データサイエンスプロジェクトの管理について、「メタデータ管理(実験管理)」という概念があります。以降、この記事では簡便のため、実験管理という表現で統一しようと思います。
実験管理の重要なポイントは、「シェアビリティ」と「記録の容易さ」「再現性」だと考えています。分析グループにはデータサイエンティストが4名在籍しており(2022/9時点)、各々のプロジェクトもあれば、複数人で共通の大型プロジェクトもあり、情報の共有に際しては共通のフォーマットがあると便利です。理想形は、データサイエンティストの誰がやってもモデル構築のプロセスと結果を再現できるよう、実行環境の情報や利用した具体的なデータ、コードスクリプト、機械学習のアルゴリズム、ハイパーパラメータなどの情報を記録しておくことです。しかし、「シェアビリティ」と「記録の容易さ」は実際にはトレードオフの関係にあり、他の人が結果を再現できるよう情報を記録すればするほど、記録の負荷はあがると言えます。そのため、記録の負荷をなるべく上げないためにも、繰返し記録することになる情報(例えば、実行環境のコンテナイメージ、処理開始&終了時間、データの置き場所、など)は一度きりの記述で自動的に連携されるような仕組みがあると望ましいです。
SageMaker Experimentsを用いれば、パイプラインの定義スクリプトにコードを一度書けば、その情報が自動的に記録されるので、データサイエンティストは記録したい実験に関する指標のみに集中すればよいことになります。また、任意で記録したい指標のコーディングについては、SageMaker SDKを使えば以下のように数行レベルで済むので、記録について最低限の負荷で済むと言えそうです。
![]()
やったこと(Action)
命名規則の整理
コンセプト的にマッチしているマネージドサービスを導入していくのは良いアプローチだと思いますが、それだけでは十分に活用できません。SageMaker ExperimentsはExperimentとTrialという小概念があります。
| 概念 | 簡単な説明 |
|---|---|
| Experiment | Trialを一定の粒度で集めた概念。分析PJや特定のプロダクトなど、何か特定の事例を表すことが多い。 |
| Trial | 機械学習プロセスの個別の処理。 |
概念が細分化されているため、それぞれの命名規則や使い方をうまく整理しなければ、各データサイエンティストがばらばらの使い方をしてしまい、情報のシェアビリティが落ちてしまいます。そこで、以下のように命名規則を整理してみました。

実験管理にあたって、まず用途を考え、大きく2種類の用途を想定しました。「パイプラインの実験管理」および「EDAの実験管理(※)」です。
※ EDAは「探索的データ分析」のこと。
「パイプラインの実験管理」では、本番稼働しているパイプラインの情報を記録し、失敗した時など何らかの理由でパイプラインの結果を再現する必要があるときにそのプロセスを再現できるようにします。上図の「trialの命名」欄にある命名規則に従った①のTrialを見れば、実行環境に関する情報について、SageMaker Pipelinesが自動で作ってくれた情報を確認することができ、②の命名規則に沿ったTrialを見れば、データサイエンティストが任意で記録した各種指標を確認することができます。
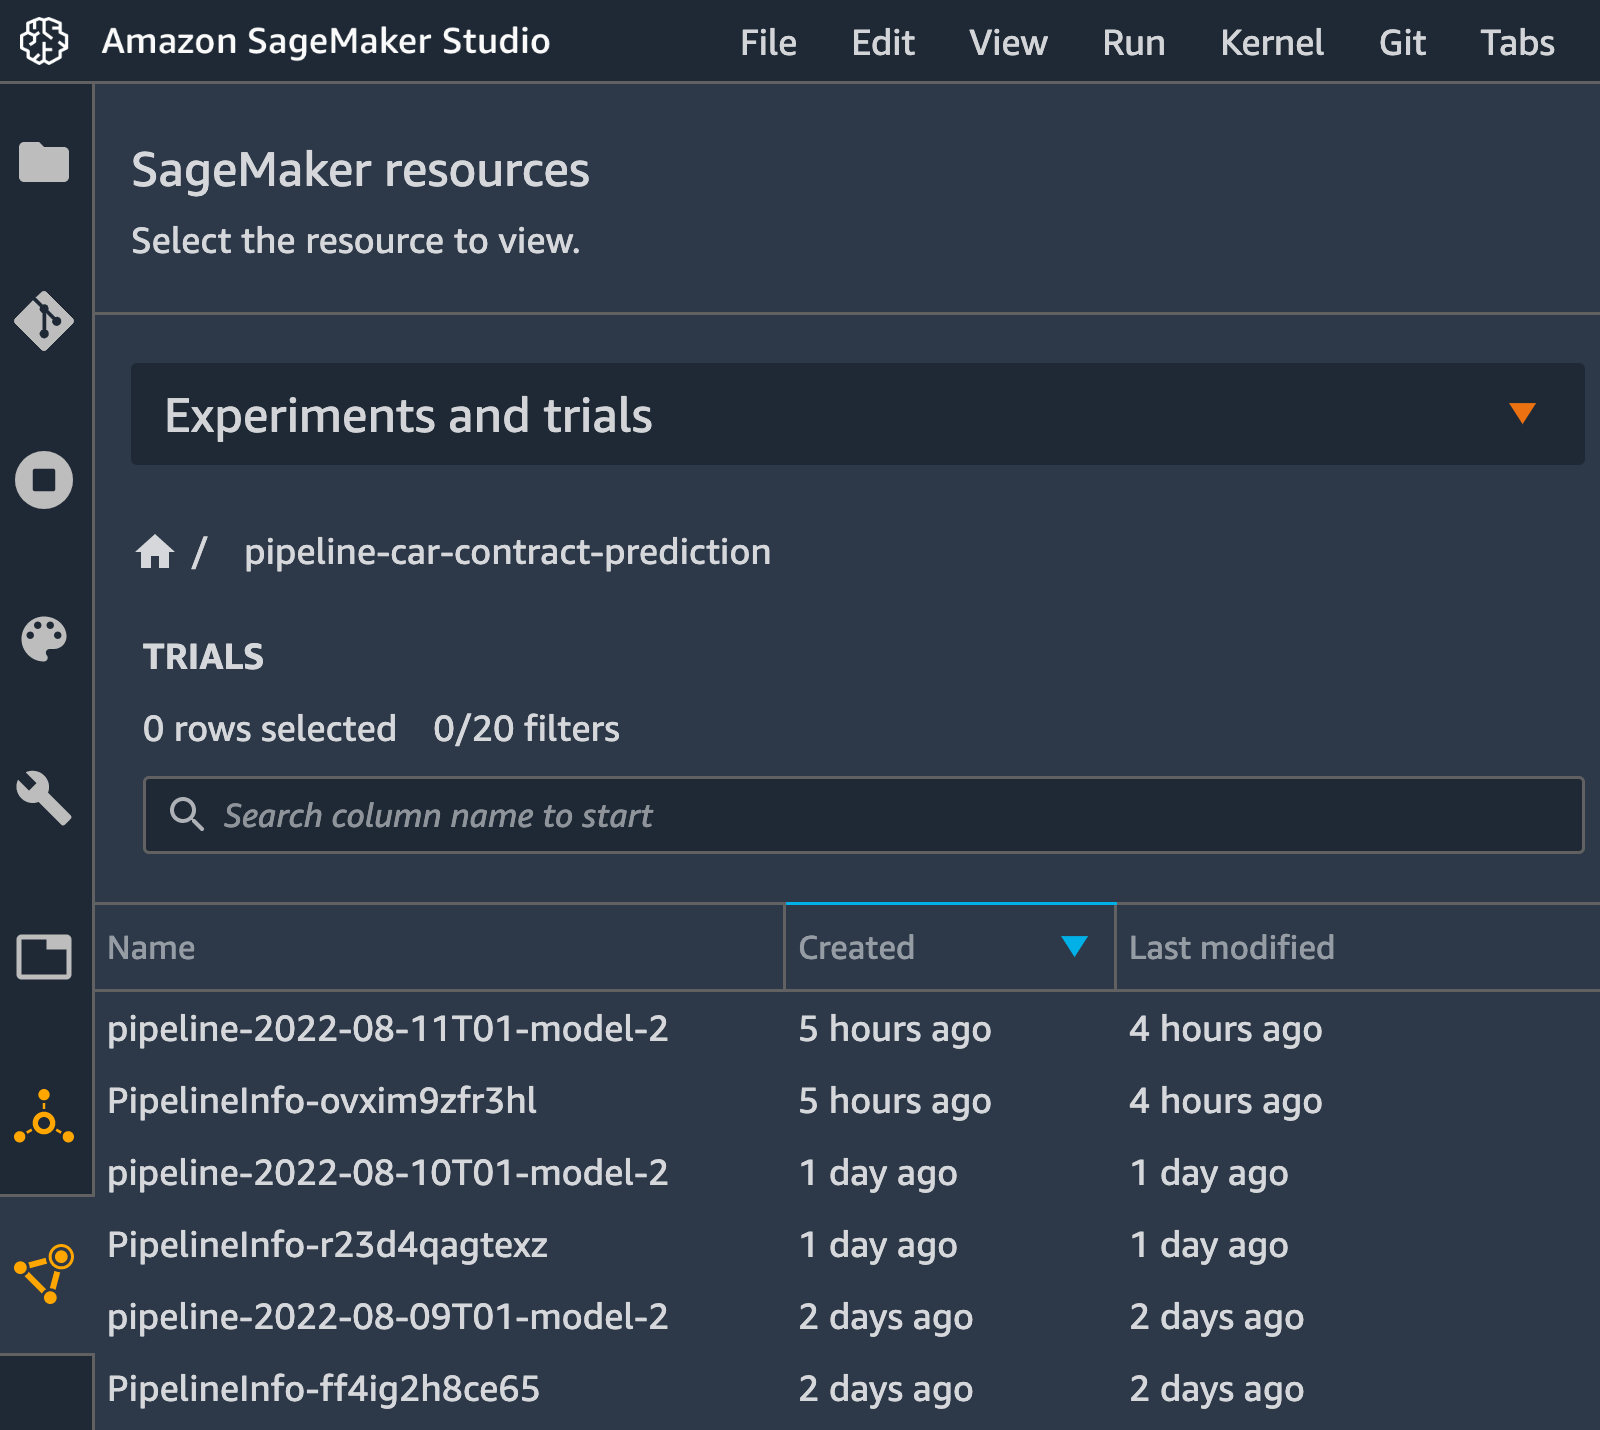
一方で、本番稼働のパイプラインとは別で、モデルをより良くするために実験を都度実施し、その結果も記録して後で参照できるようにしたいというケースもあります。「EDAの実験管理」ではまさにそういったニーズに対応できるように、命名規則をあえて緩く設定しており、「debug-」とついたExperimentに関しては、Trial名はデータサイエンティストの実験の意図に応じて自由に決められるようにしています(実験パターンがある程度存在するようならそれに応じて設定を改めて検討するかもしれません)。
結果(Result)
上記の命名規則も併せてSageMaker Experimentsを使うことで実験管理を行うだけでなく、実施した実験(および本番稼働のパイプライン)の結果の分析もできます。過去のパイプラインの分析に関する指標をサクッと確認したいときは②の命名規則に沿ったTrialをGUIで確認できますが、本番稼働しているパイプラインの結果の推移を追いたいときなど、複数の実験結果を比較して分析したいときは、SageMaker Experimentsの結果をpandasのDataFrameにして分析したりすることができます。例えば、日次実行しているパイプラインの適合率について、折れ線グラフ上で推移を表示して確認したりできます。結果の可視化を行うことで、本番稼働しているパイプラインがモデルドリフトを起こしていないか確認したりできるでしょう。運用を通じてフィードバックを迅速に得ることで、モデルの再開発や微調整、継続的学習といったプロセスを素早く開始することも期待できます。
いかがでしたでしょうか。最終回となる次回の連載では、社内で実施した勉強会のお話を通じて、どのように知識を共有しているか、ご紹介したいと思います。引続きご覧いただける際は「SageMaker勉強会と文化醸成(4/4)よりご覧ください。また、Tech Blogのツイッターもやっているので、本ページ最下部からフォローいただけると嬉しいです。
関連記事 | Related Posts
We are hiring!
【データサイエンティスト】データサイエンスG/東京・名古屋・福岡
デジタル戦略部についてデジタル戦略部は、現在45名の組織です。
ビジネスアナリスト(マーケティング/事業分析)/分析プロデュースG/東京・大阪・福岡
デジタル戦略部 分析プロデュースグループについて本グループは、『KINTO』において経営注力のもと立ち上げられた分析組織です。決まった正解が少ない環境の中で、「なぜ」を起点に事業と向き合い、分析を軸に意思決定を前に進める役割を担っています。

