Webサービスにおけるメモリリークの原因調査と解決
はじめに
こんにちは!KTCグローバル開発部に所属している崔です。
現在KINTO FACTORYの開発に参加しており、今年はチームメンバーと一緒にWebサービス内のメモリリークの原因を調査し、特定した問題点を修正して解決しました。
このブログでは、調査アプローチ、使用したツール、調査結果、そしてメモリリークに対処するための措置について詳しく説明します。
背景
私たちが現在開発・運用しているKINTO FACTORYサイトには、AWSのECS上で動作しているWebサービスがあります。
このサービスでは、当社が開発・運営している認証サービスである会員PF(Platform)と決済サービスである決済PF(Platform)を利用しています。
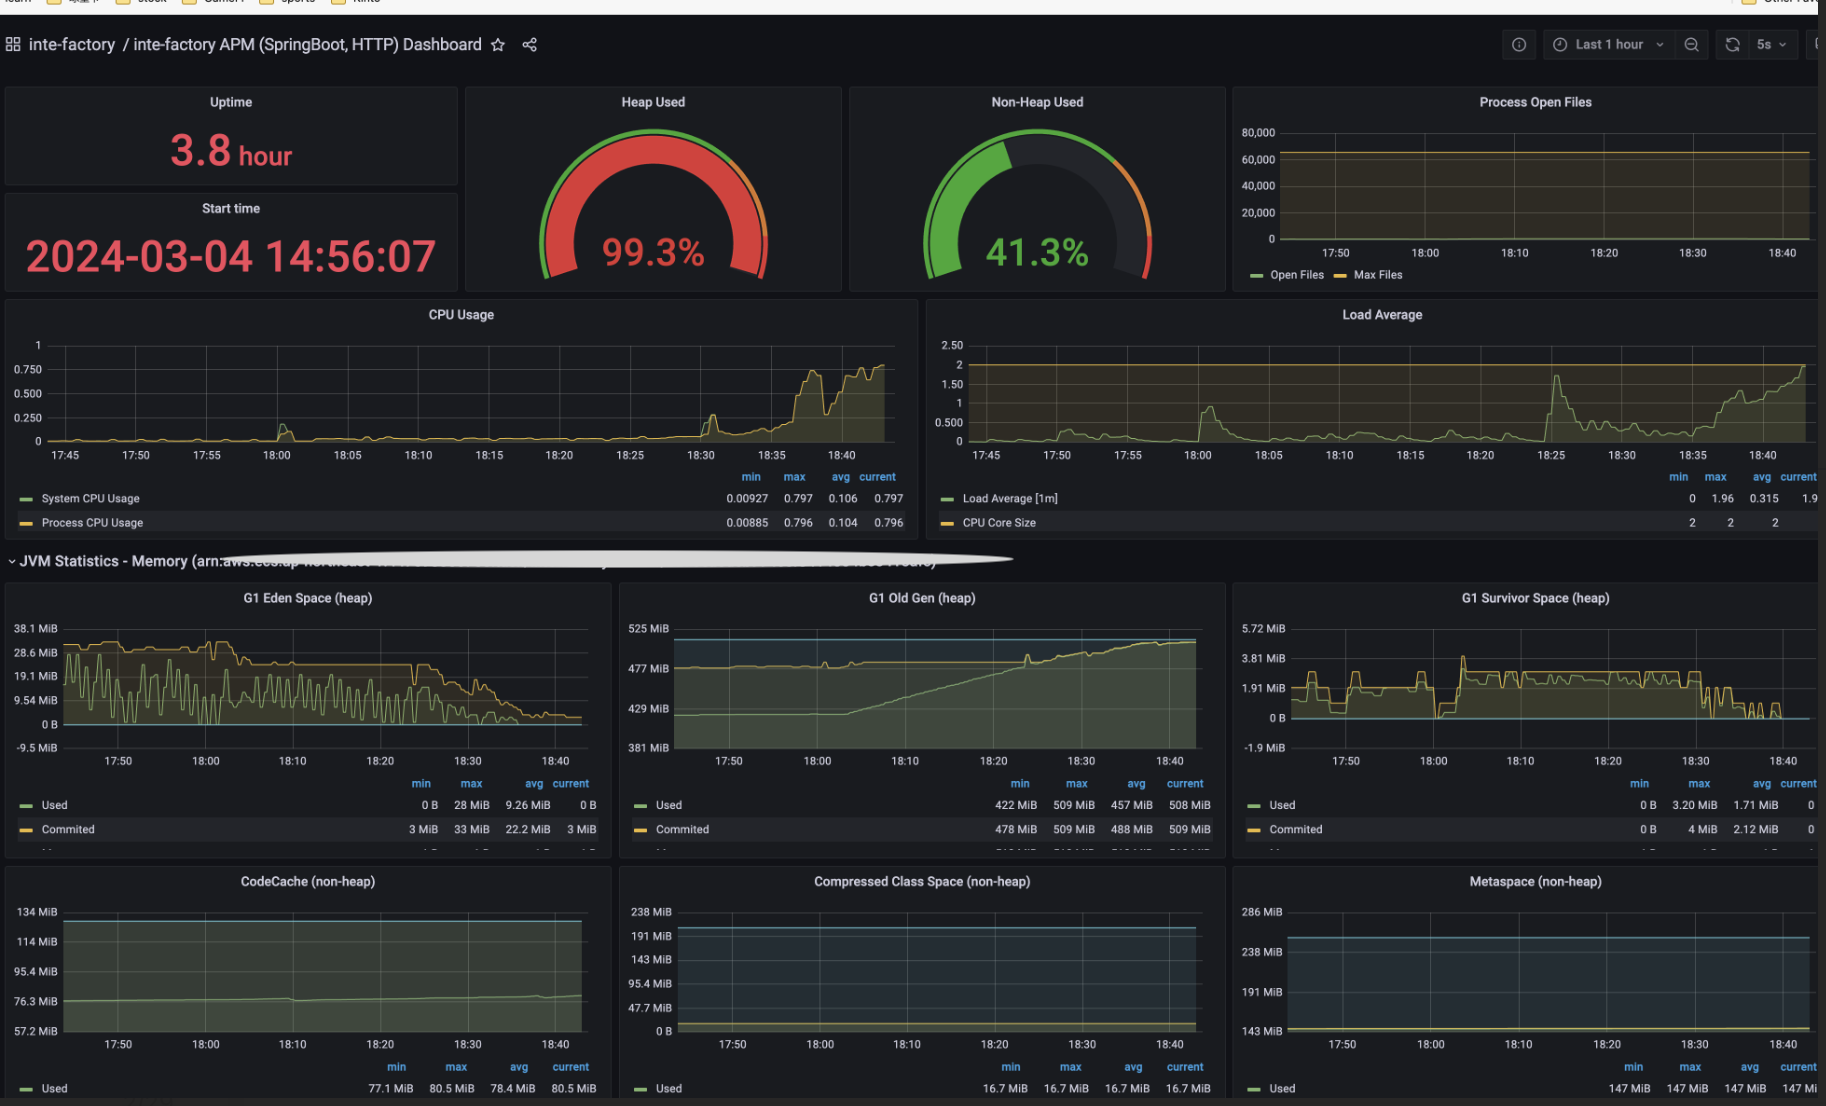
今年1月に、このWebサービスでECSタスクのCPU使用率が異常に高まり、一時的にサービスにアクセスできない事態が発生しました。
この際、KINTO FACTORYサイトで特定の画面遷移や操作を行うと404エラーやエラーダイアログが表示されるインシデントが発生しました。
昨年7月にも類似のメモリリークが発生しており、Full GC(Old領域のクリア)が頻繁に発生し、それに伴うCPU使用率の増加が原因であることが判明しました。
これらの事象が発生した場合、一時対策としてECSタスクの再起動で解決できますが、メモリリークの根本原因を究明し、解決する必要があります。
本記事では、これらの事例を踏まえ、現象の調査・分析とそれに基づいた解決策を記載しています。
調査内容と結果の要約
調査内容
最初に、本件で発生した事象の詳細を分析すると、WebサービスのCPU使用率が異常に高まるのは、Full GC(Old領域のクリア)が頻繁に発生することで起きた問題あることが分かりました。
通常、Full GCが一度行われると、多くのメモリが解放され、しばらくの間は再度発生することはありません。
にもかかわらず、Full GCが頻繁に発生するのは、使用中のメモリが過剰に消費されている可能性が高く、これはメモリリークが発生していることを示唆しています。
この仮説を検証するために、メモリリークが発生した期間中に多く呼ばれたAPIを中心に長時間APIを呼び出し続け、
メモリリークを再現させました。その後、メモリの状況やダンプを分析して原因を探ります。
調査に使用したツールは以下の通りです:
- JMeter でのAPIのトラフィックシミュレーション
- VisualVM と Grafana を用いたメモリ状態の監視(ローカル環境および検証環境)
- OpenSearch で頻繁に呼び出されるAPIのフィルタリング
また、本文によく現れているメモリの「Old領域」について以下の通りに簡単に説明します:
Javaのメモリ管理では、ヒープ領域がYoung領域とOld領域に分かれています。
Young領域には新しく作成されたオブジェクトが格納され、ここで一定期間存続したオブジェクトはSurvivor領域を経てOld領域に移動します。
Old領域には長期間存続するオブジェクトが格納され、ここがいっぱいになるとFull GCが発生します。
Survivor領域はYoung領域内の一部で、オブジェクトがどれだけ長く生存しているかを追跡します。
調査結果
外部サービスのリクエスト時に接続インスタンスが大量に新規作成されており、メモリが無駄に占有されていることによるメモリリークが発生していました。
調査内容の詳細
1. 呼び出し回数が多かったAPIの洗い出し
最初に、多く呼ばれている処理とメモリ使用状況を知るため、OpenSearchでAPI呼び出しサマリのダッシュボードを作成しました。
![]()
2. 洗い出ししたAPIをローカル環境で30分間呼び出し続け、結果を分析
調査方法
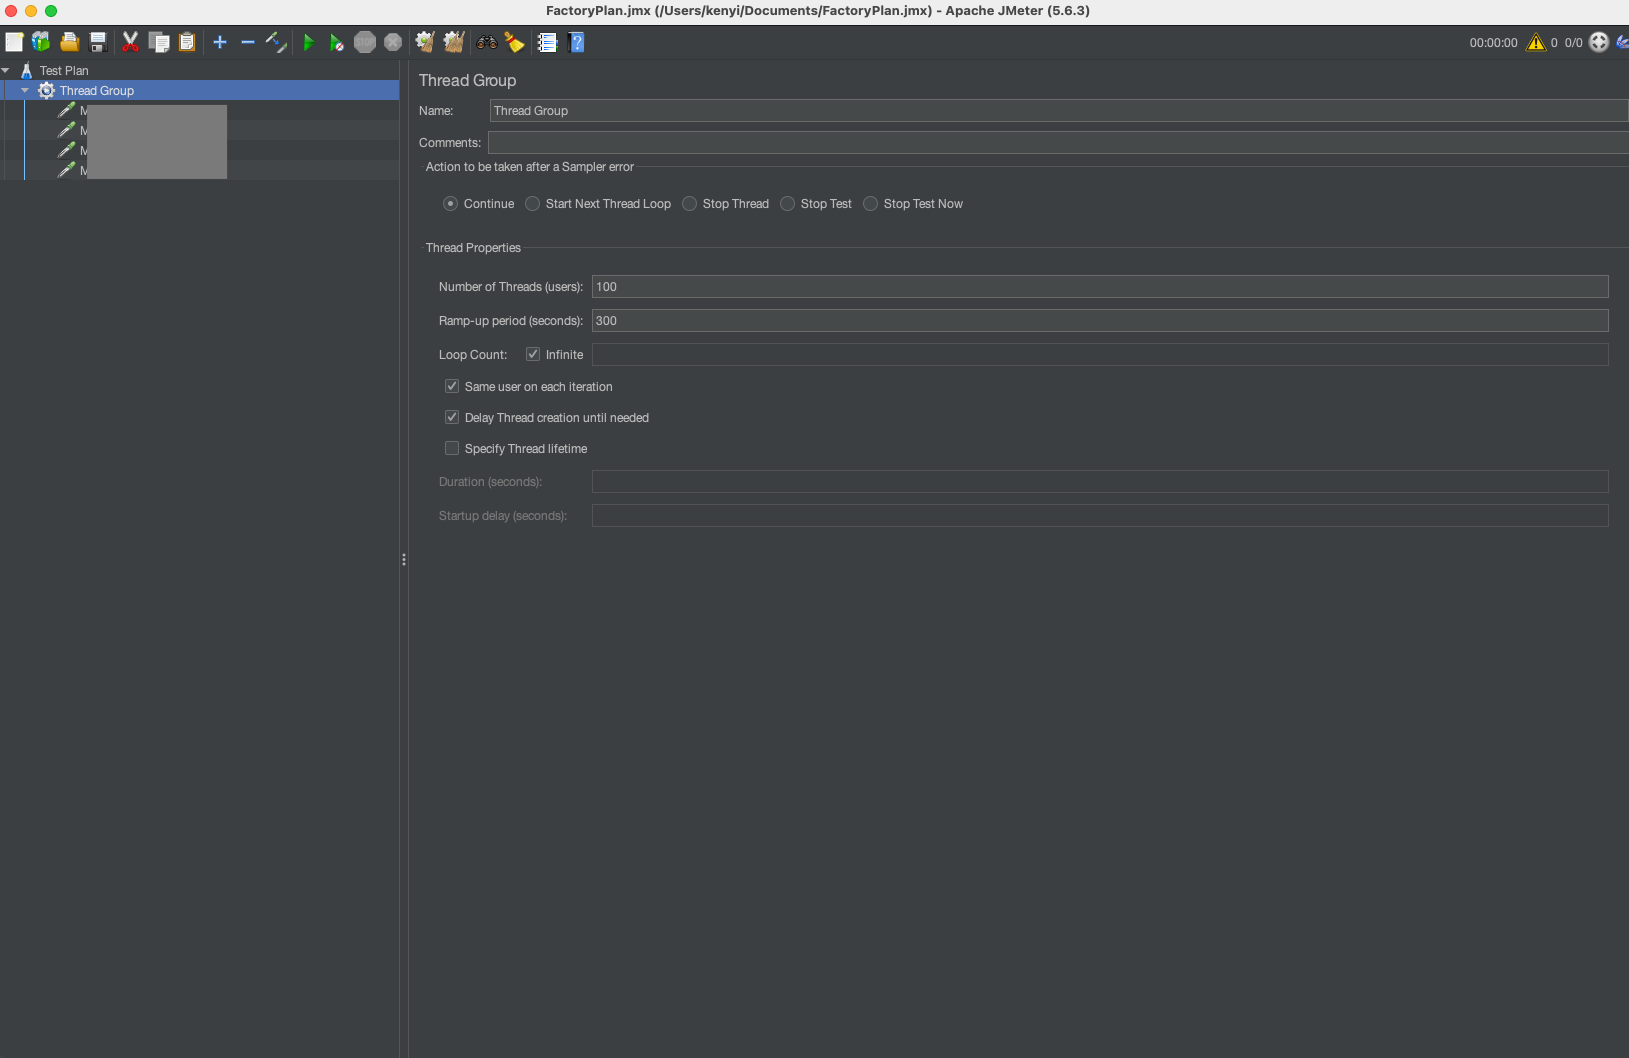
メモリリークをローカル環境で再現させ、ダンプを取り原因分析を行うため、以下の設定でJMeterを使用してAPIを30分間呼び出し続けました。
- JMeterの設定
- スレッド数:100
- Ramp-up期間(※):300秒
- テスト環境
- Mac OS
- Javaバージョン:openjdk 17.0.7 2023-04-18 LTS
- Java設定:-Xms1024m -Xmx3072m
※Ramp-up期間とは:設定したスレッド数を何秒以内に起動・実行するかの指定される秒数です。
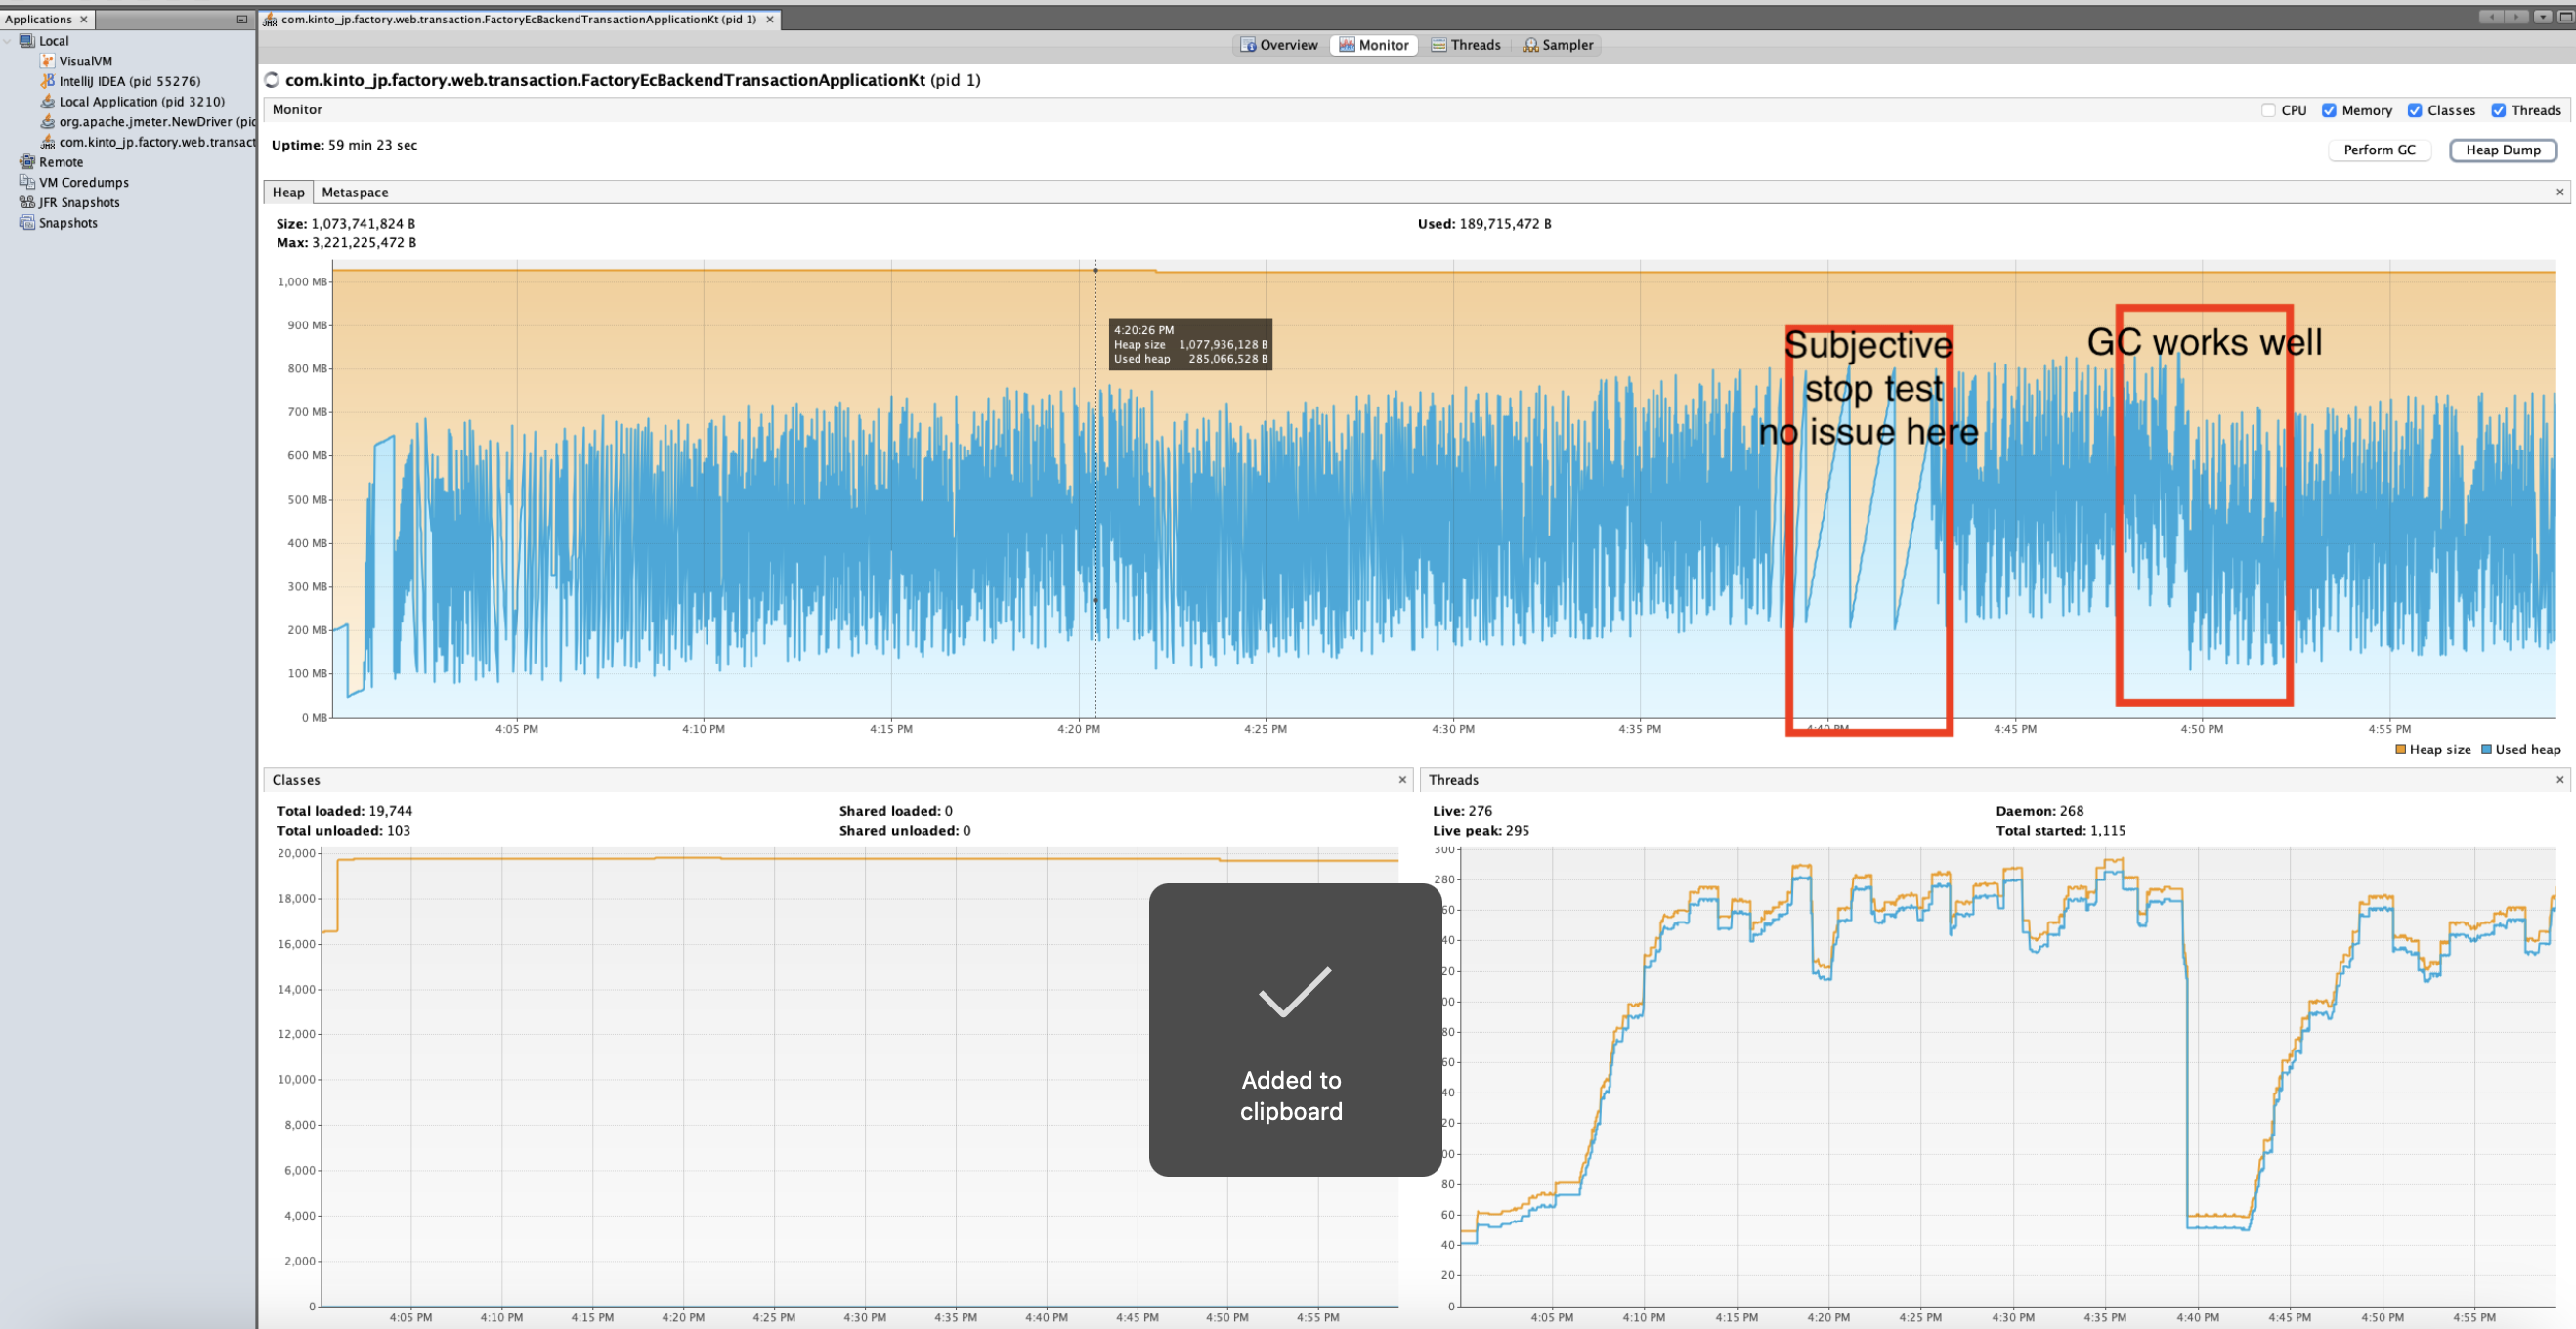
結果と仮説
メモリリークは起きませんでした。実際の環境と異なるためメモリリークが再現しなかったと考えました。実際の環境はDockerで動作しているため、アプリケーションをDockerコンテナに入れて再度検証することにしました。
![]()
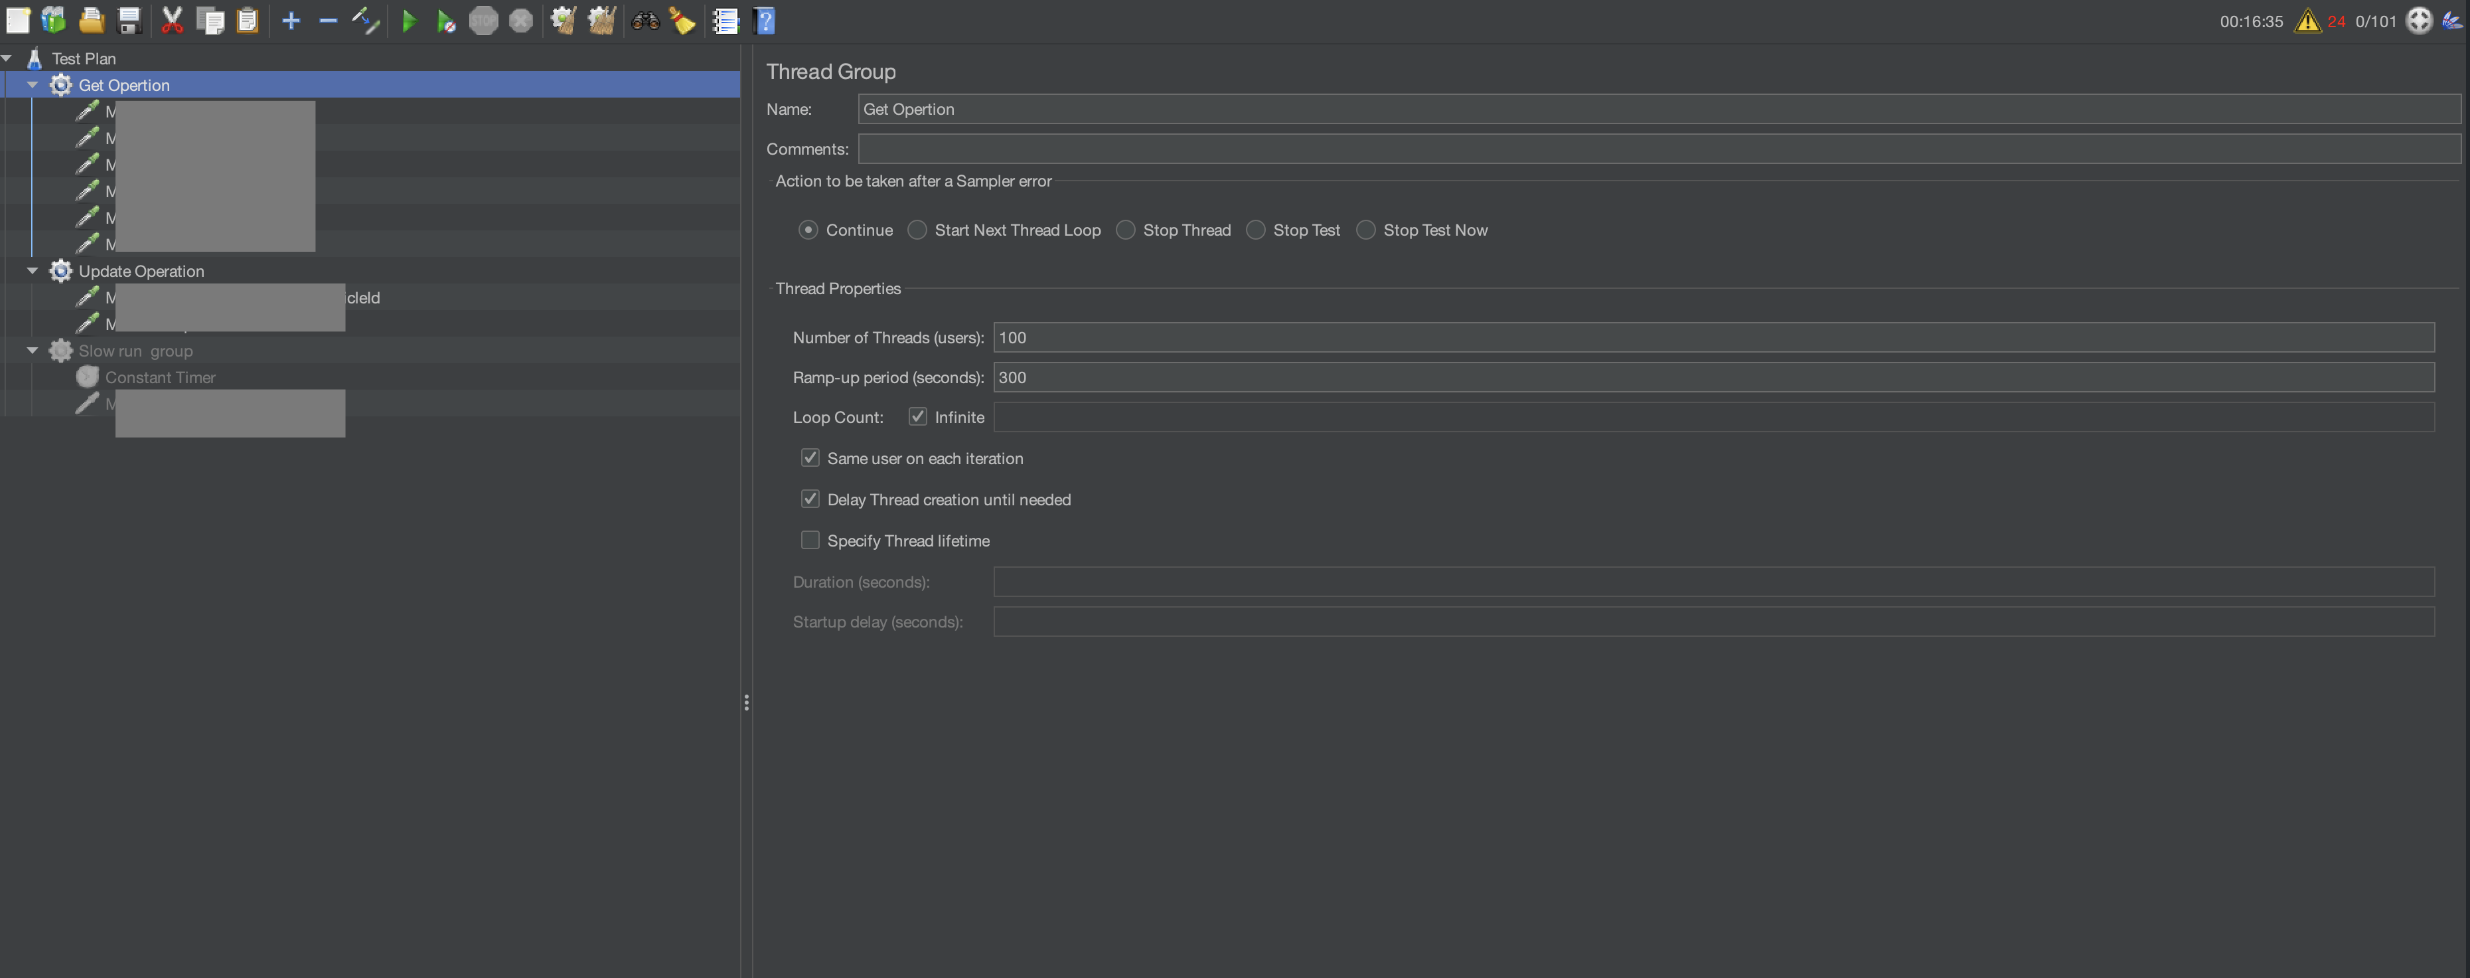
3. Docker環境で再度APIを呼び出し続け、結果を分析
調査方法
メモリリークをローカル環境で再現させるため、以下の設定でJMeterを使用してAPIを1時間呼び出し続けました。
- JMeterの設定
- スレッド数:100
- Ramp-up期間:300秒
- テスト環境
- ローカルDockerコンテナ(Mac上)
- メモリ制限:4 GB
- CPU制限:4コア
結果
ローカル環境で環境を変えてもメモリリークは起きませんでした。
仮説
- 実際の環境と異なる
- 外部APIを呼び出していない
- 長時間にわたるAPI呼び出しで少しずつメモリが蓄積される可能性がある
- 大きすぎるオブジェクトがSurvivorに入らず、Old領域に入ってしまう可能性がある
やはりローカル環境では再現できないため、本番環境に近い検証環境で再度検証することにしました。
4. 検証環境で外部API関連を長時間叩き続け、結果を分析
調査方法
メモリリークを検証環境で再現させるため、以下の設定でJMeterを使用してAPIを呼び出し続けました。
- 呼び出し対象API:それぞれ計7本
- 継続期間:5時間
- ユーザー数:2
- ループ:200(1000を予定していたが、実際のOrderは少ないため200に変更)
- Factory API合計呼び出し回数:4000
- 影響がある外部PF:会員PF(1600回)、決済PF(200回)
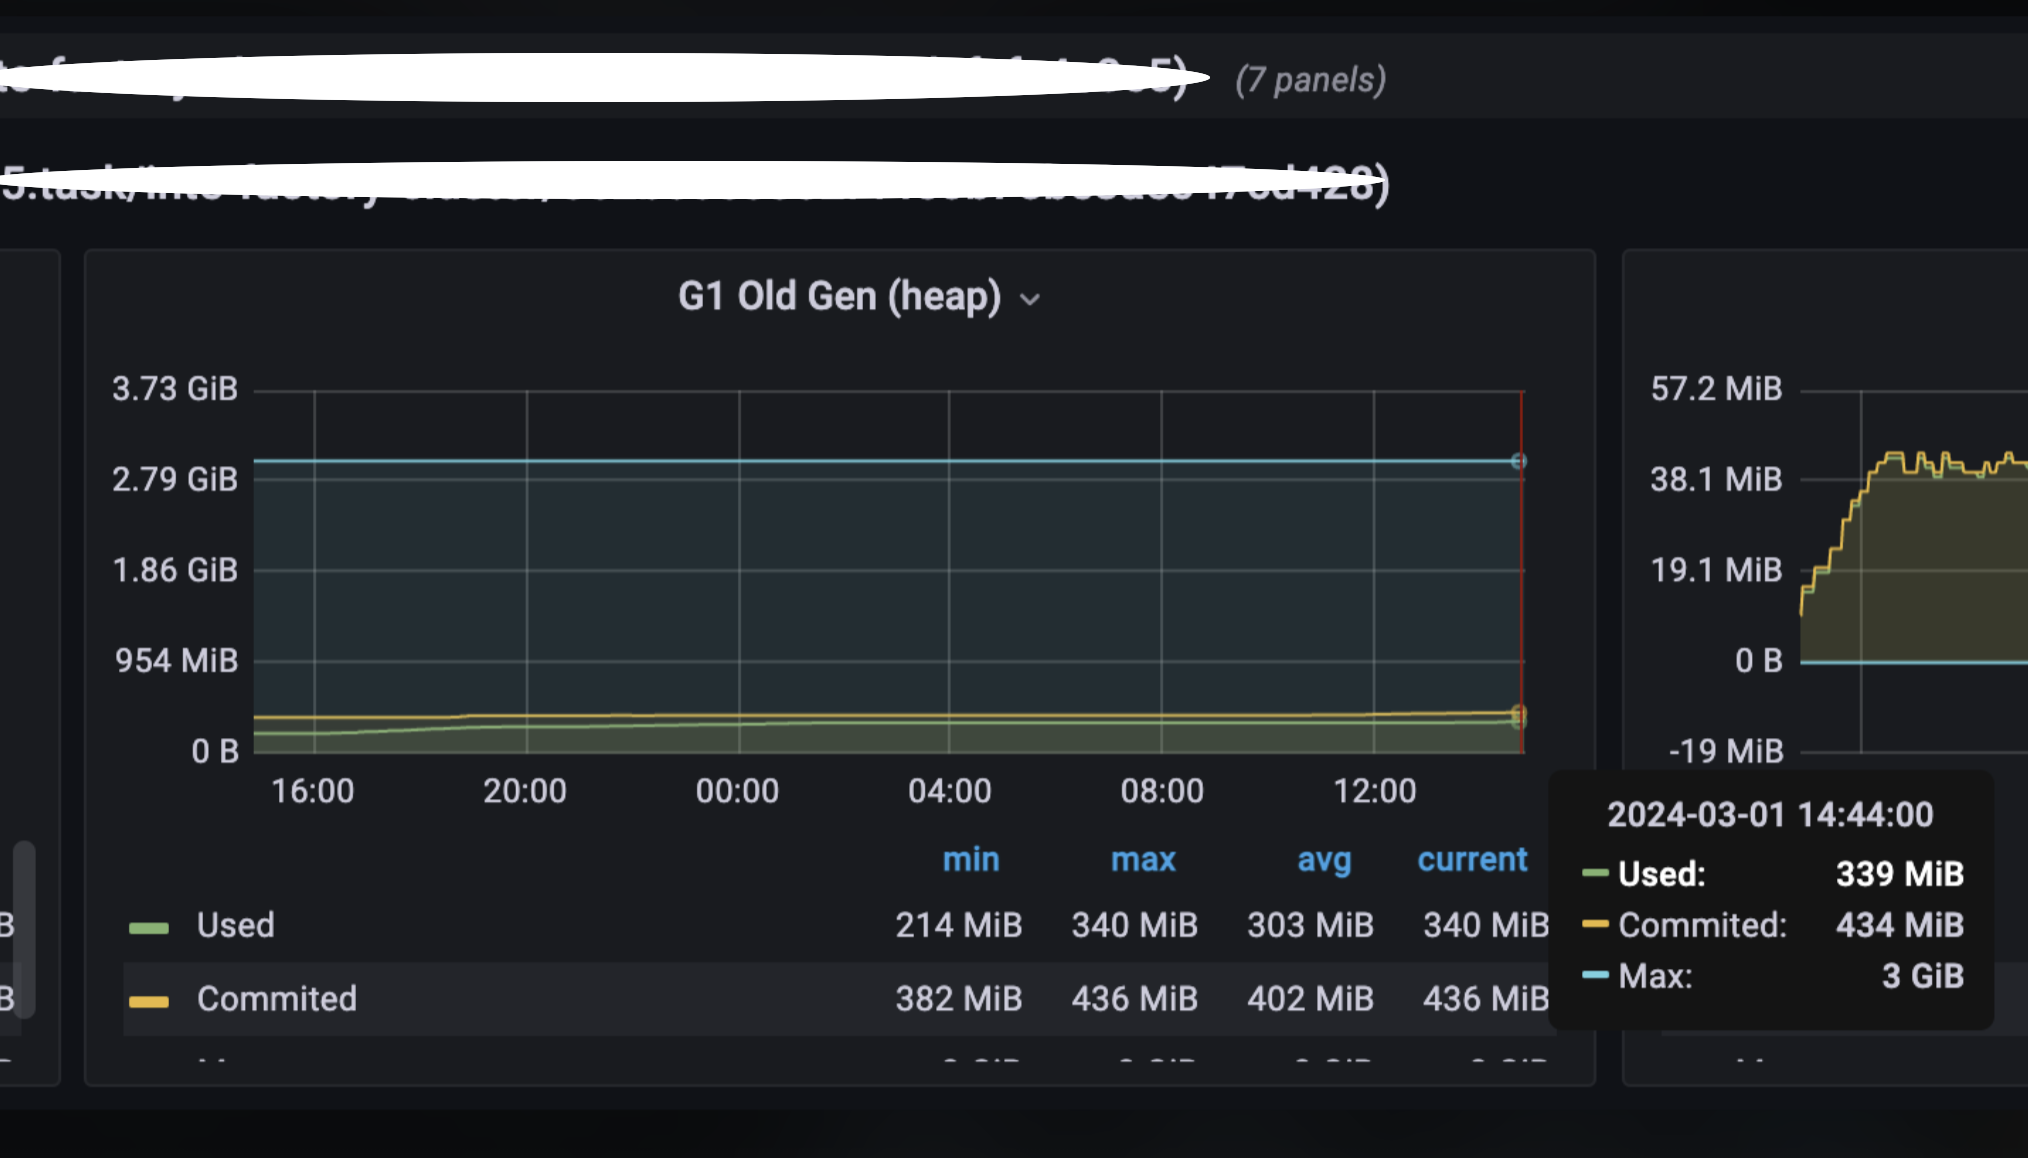
結果
Full GCが発生せず、メモリリーク現象は再現しませんでした。
仮説
ループ回数が少なく、メモリ使用量が増加しているが上限に達していないためFull GCが発動されなかった。呼び出し数を増やし、メモリ上限を下げてFull GCを発生させるようにします。
5. メモリ上限を下げ、APIを長時間叩き続ける
調査方法
検証環境でメモリ上限を下げて、JMeterで会員PF関連APIを4時間呼び出し続けました。
- 時間:4時間
- API:前回と同じ7つのAPI
- 頻度:12ループ/分(5秒/ループ)
- 会員PF呼び出し頻度:84回/分
- 4時間の会員PF呼び出し回数:20164回
- ダンプ取得設定:
- export APPLICATION_JAVA_DUMP_OPTIONS='-XX:+HeapDumpOnOutOfMemoryError -XX:HeapDumpPath=/var/log/app/ -XX:OnOutOfMemoryError="stop-java %p;" -XX:OnError="stop-java %p;" -XX:ErrorFile=/var/log/app/hs_err_%p.log -Xlog:gc*=info:file=/var/log/app/gc_%t.log:time,uptime,level,tags:filecount=5,filesize=10m'
- ECSのメモリ上限設定:
- export APPLICATION_JAVA_TOOL_OPTIONS='-Xms512m -Xmx512m -XX:MaxMetaspaceSize=256m -XX:MetaspaceSize=256m -Xss1024k -XX:MaxDirectMemorySize=32m -XX:-UseCodeCacheFlushing -XX:InitialCodeCacheSize=128m -XX:ReservedCodeCacheSize=128m --illegal-access=deny'
結果
メモリリークの再現に成功し、ダンプを取得できました。
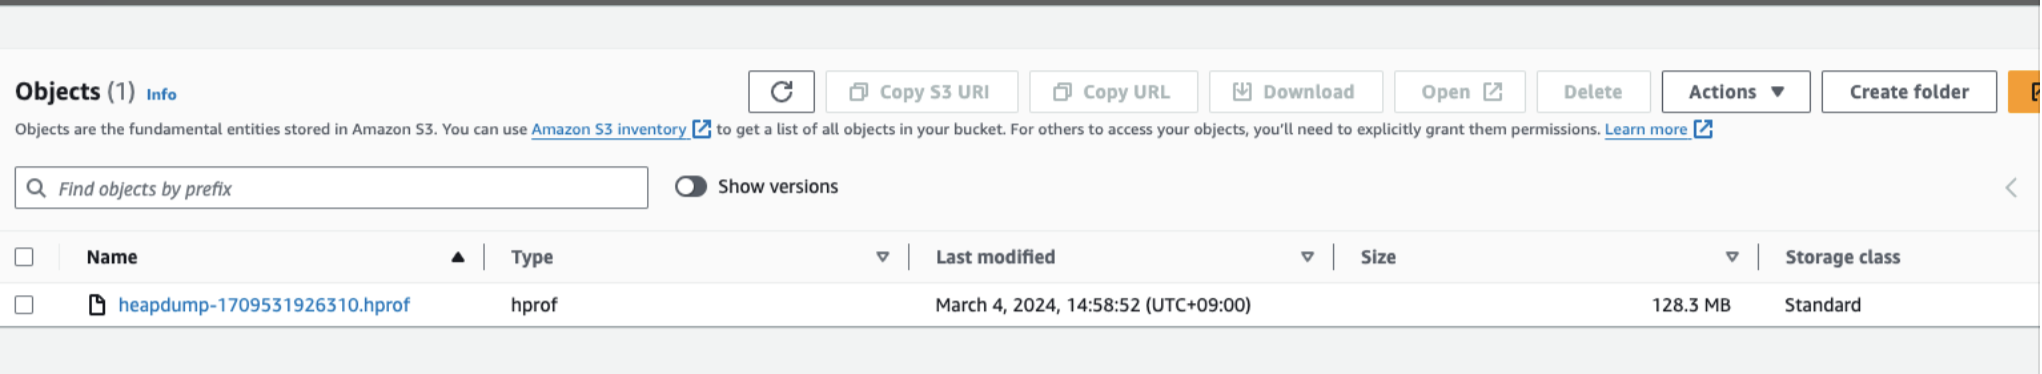
IntelliJ IDEAでダンプファイルを開くと、メモリの詳細情報を見ることができます。
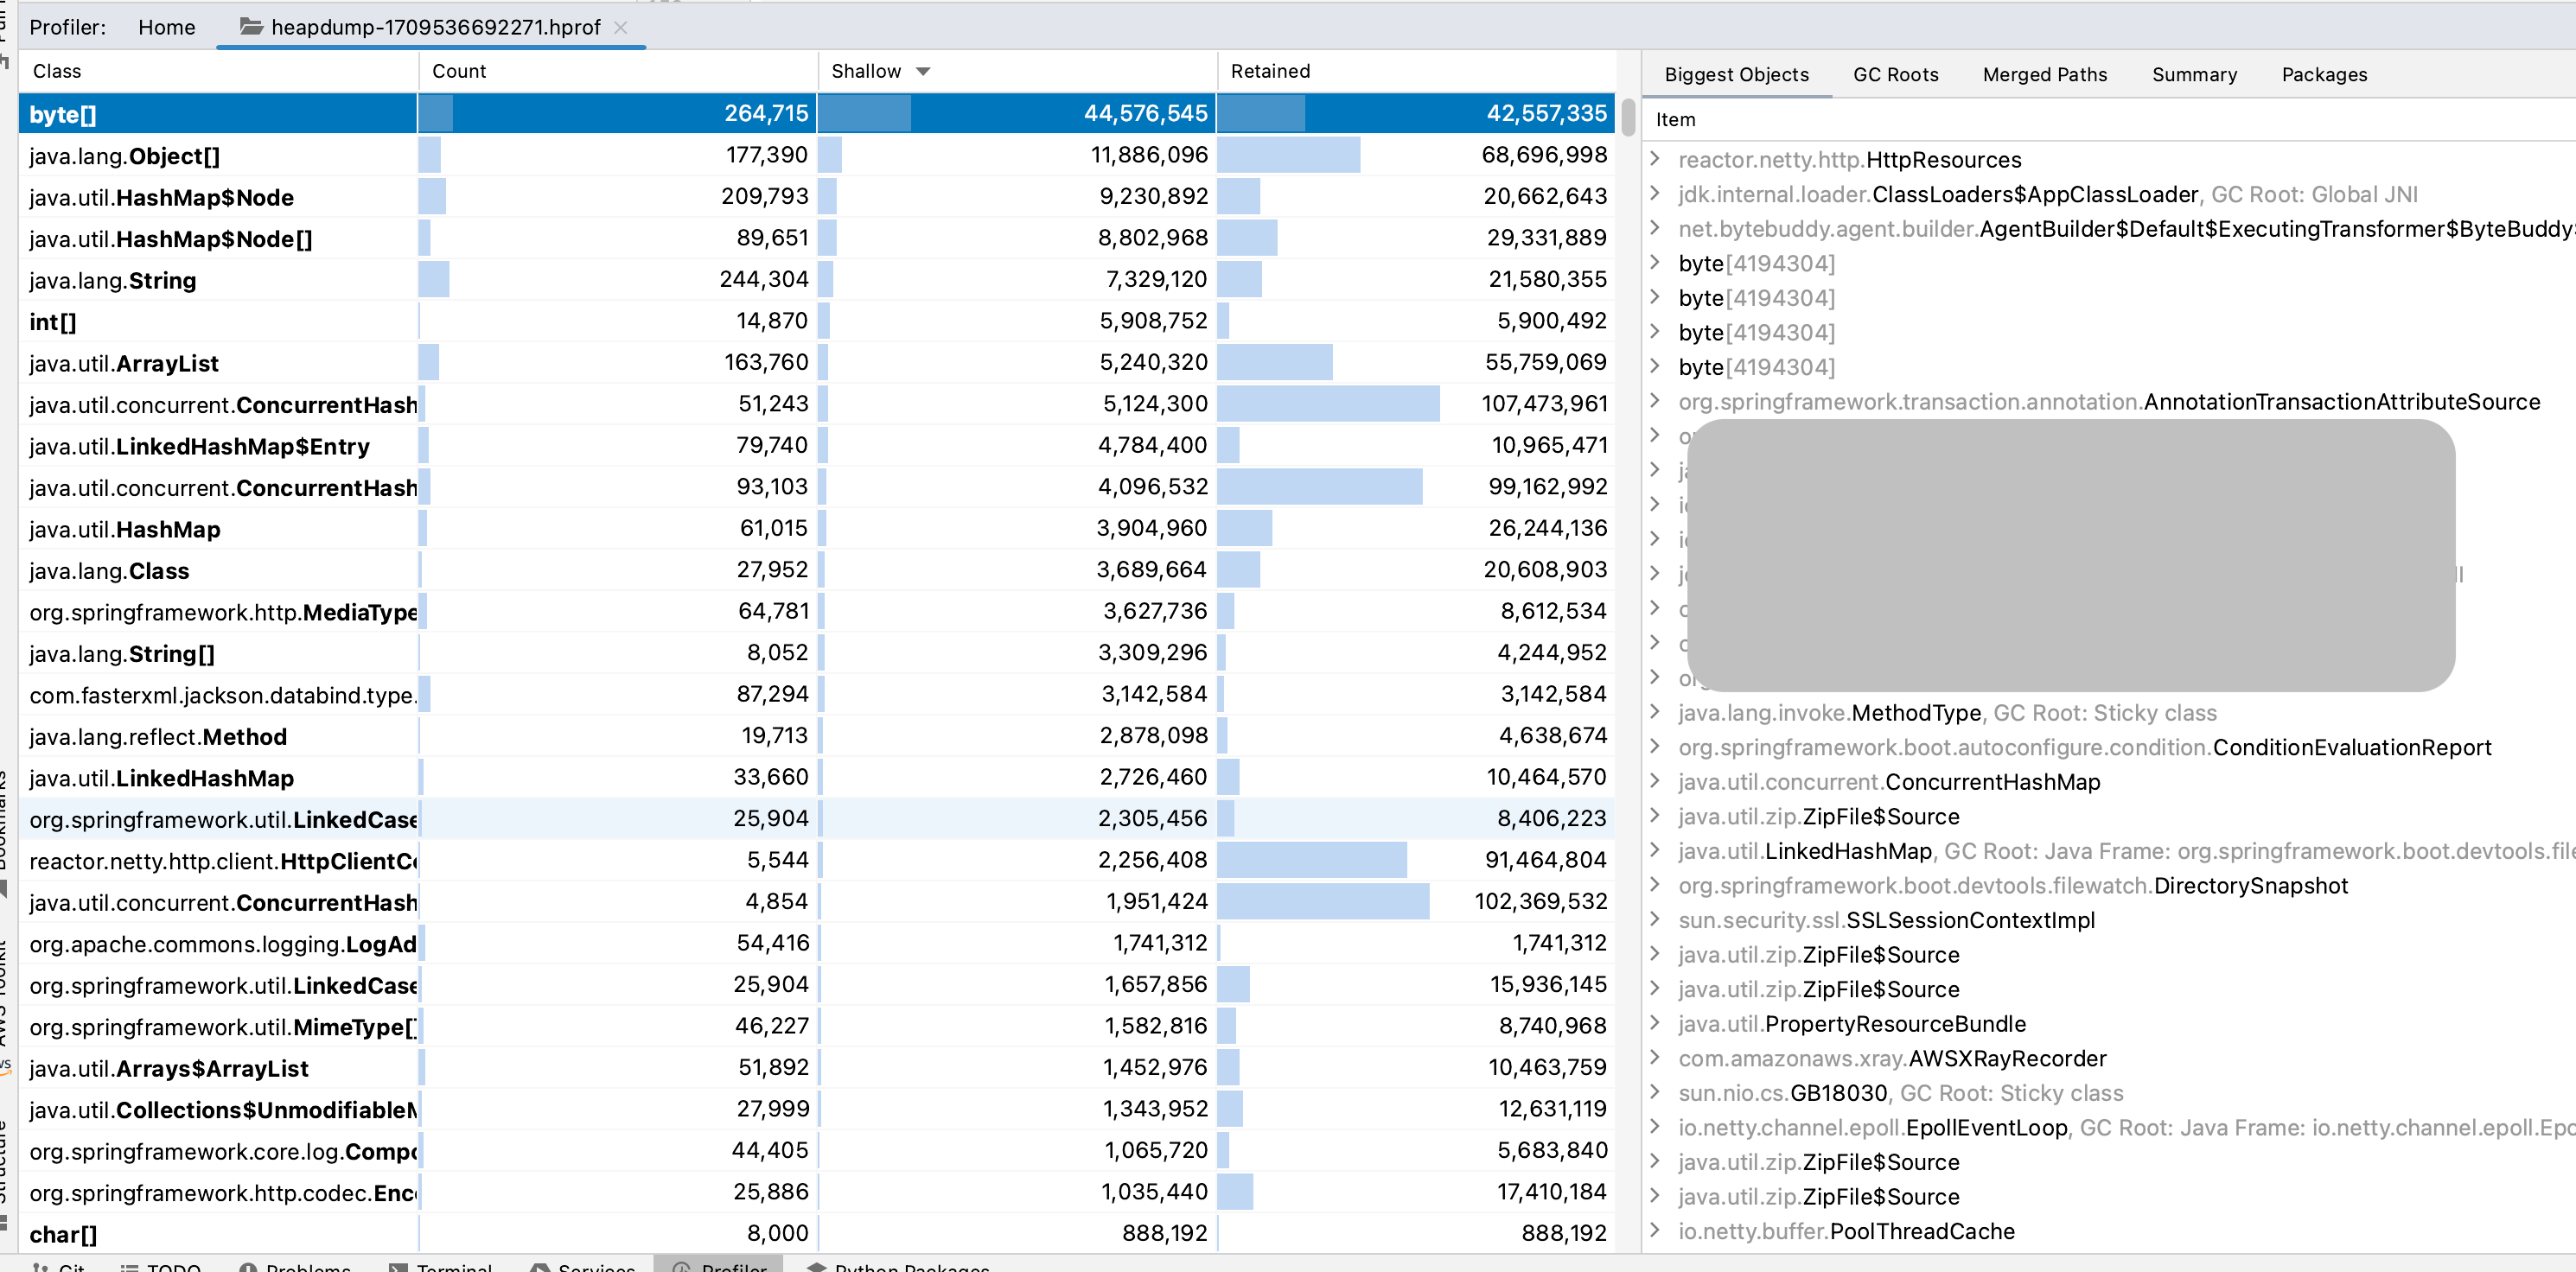
ダンプファイルを詳しく分析したところ、外部API関連部分でリクエストごとに大量のオブジェクトが新規作成されていること、Util系クラスの一部がSingletonとして扱われていないことが判明しました。
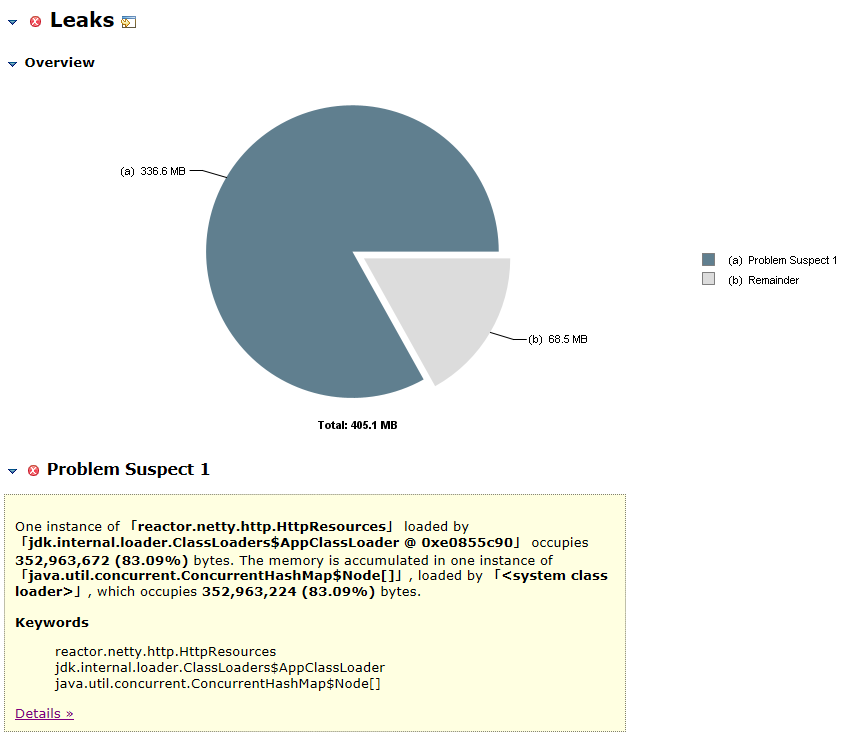
6. Heap Dumpの分析結果
reactor.netty.http.HttpResources内にHashMap$Nodeが5,410個作成されており、352,963,672バイト(83.09%)を専有していることが分かりました。
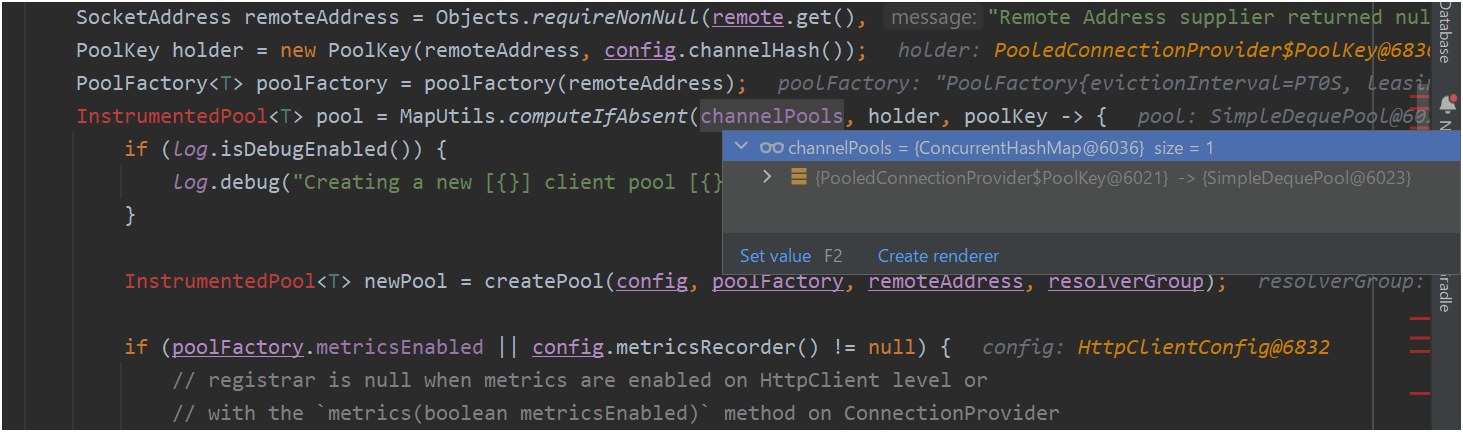
メモリリーク発生箇所特定
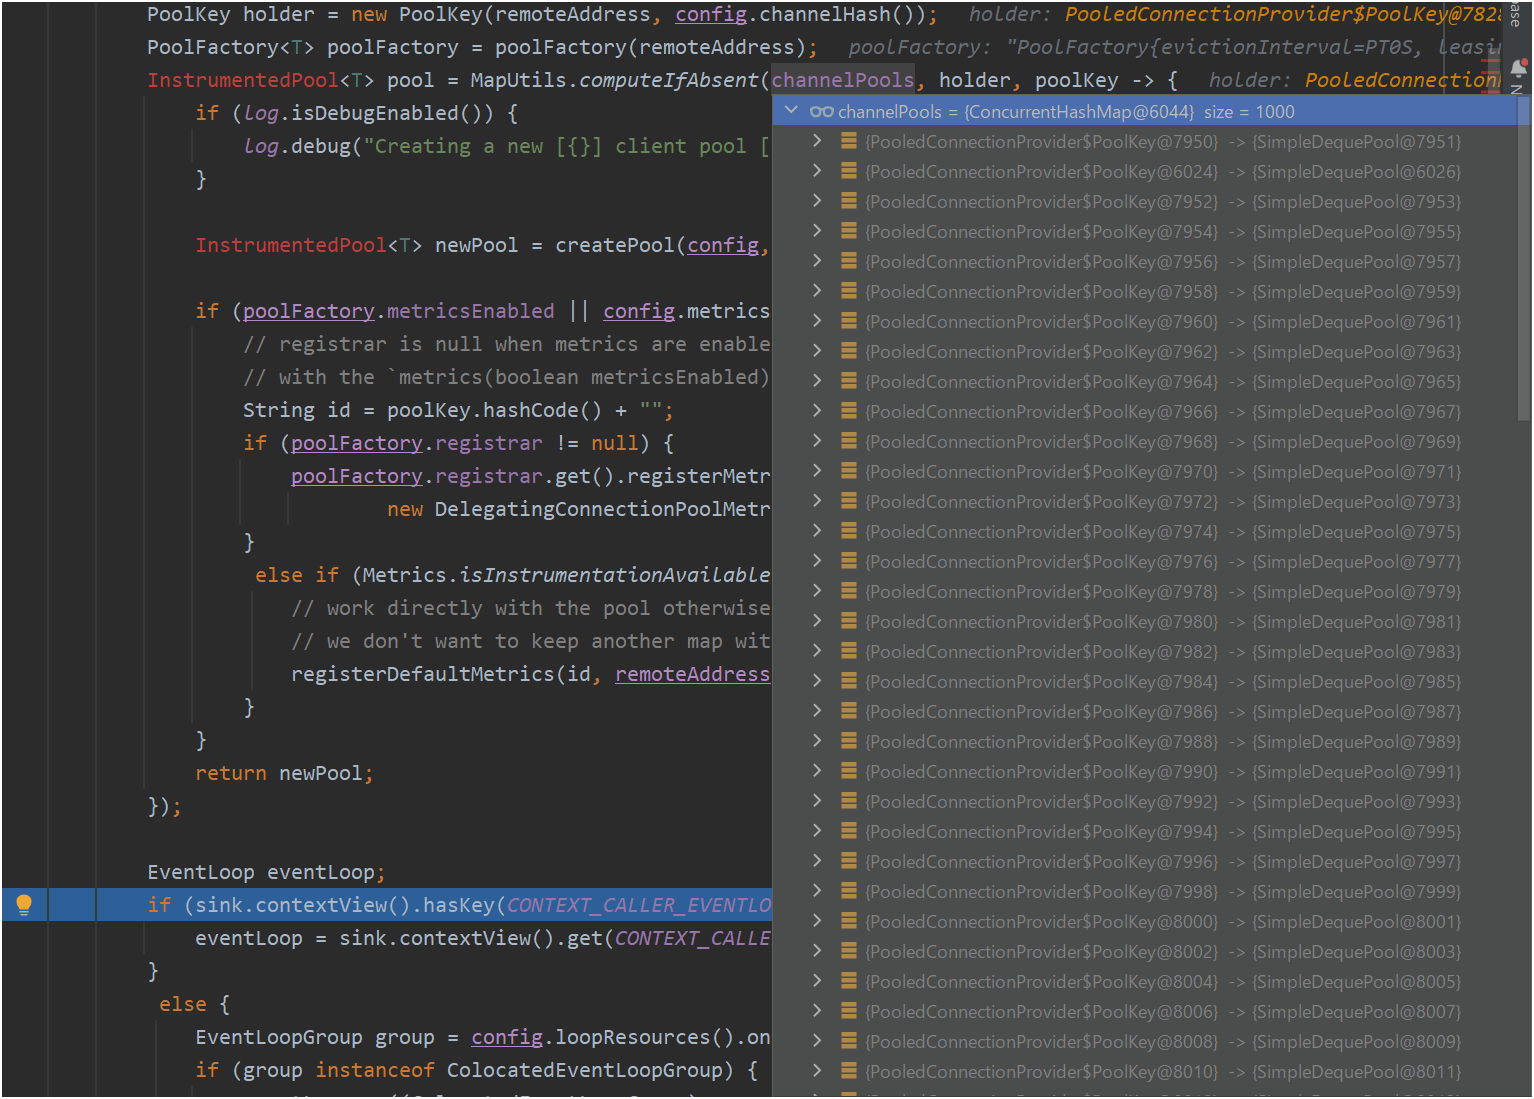
reactor.netty.resources.PooledConnectionProvider内のchannelPools(ConcurrentHashMap)でリークが発生しており、格納と取得のロジックに着目しました。poolFactory(InstrumentedPool)取得箇所remote(Supplier<? extends SocketAddress>)とconfig(HttpClientConfig)から取得したchannelHashでholder(PoolKey)を作成holder(PoolKey)でchannelPoolsからpoolFactory(InstrumentedPool)を取得し、同様のキーが存在すれば返し、なければ新規作成
リークの原因は、同一設定でも同一キーと判断されないことです:
reactor.netty.resources.PooledConnectionProvider
public abstract class PooledConnectionProvider<T extends Connection> implements ConnectionProvider {
    ...
  @Override
  public final Mono<? extends Connection> acquire(
      TransportConfig config,
      ConnectionObserver connectionObserver,
      @Nullable Supplier<? extends SocketAddress> remote,
      @Nullable AddressResolverGroup<?> resolverGroup) {
    ...
    return Mono.create(sink -> {
      SocketAddress remoteAddress = Objects.requireNonNull(remote.get(), "Remote Address supplier returned null");
      PoolKey holder = new PoolKey(remoteAddress, config.channelHash());
      PoolFactory<T> poolFactory = poolFactory(remoteAddress);
      InstrumentedPool<T> pool = MapUtils.computeIfAbsent(channelPools, holder, poolKey -> {
        if (log.isDebugEnabled()) {
          log.debug("Creating a new [{}] client pool [{}] for [{}]", name, poolFactory, remoteAddress);
        }
        InstrumentedPool<T> newPool = createPool(config, poolFactory, remoteAddress, resolverGroup);

        ...

        return newPool;
      });
- channelPoolsは名称の通りChannel情報を保持しているオブジェクトで同様のリクエストが来た際に再利用を行っている。
- PoolKeyはホスト名と接続設定のHashCodeを元に作成され、更にそのHashCodeが使用される。
channelHash取得箇所
reactor.netty.http.client.HttpClientConfigの階層
Object
    + TransportConfig
        + ClientTransportConfig
            + HttpClientConfig
PooledConnectionProviderに渡されるLambda式
com.kinto_jp.factory.common.adapter.HttpSupport
L5 ここで定義されたLambda式がPooledConnectionProviderにconfig#doOnChannelInitとして引き渡される。
abstract class HttpSupport {
    ...
    private fun httpClient(connTimeout: Int, readTimeout: Int) = HttpClient.create()
        .proxyWithSystemProperties()
        .doOnChannelInit { _, channel, _ ->
            channel.config().connectTimeoutMillis = connTimeout
        }
        .responseTimeout(Duration.ofMillis(readTimeout.toLong()))
    ...
}
7. channelPools取得時の挙動(図解)
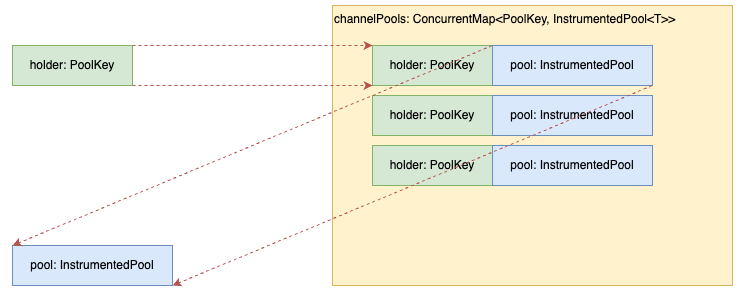
キーが一致するケース(正常)
channelPoolsに存在する情報がキーとなり、InstrumentedPoolが再利用される。
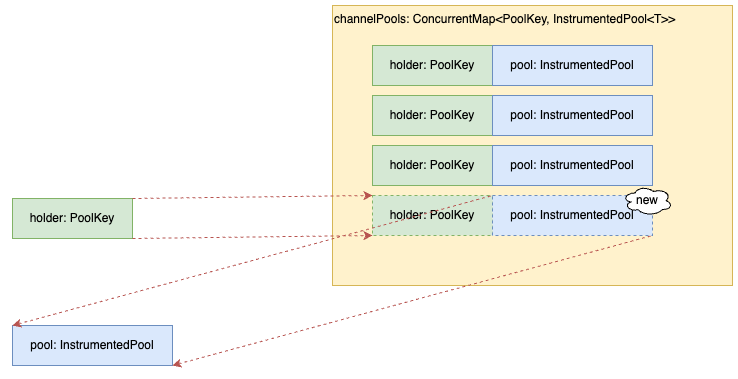
キーが不一致のケース(正常)
channelPoolsに存在しない情報がキーとなり、InstrumentedPoolが新規作成される。
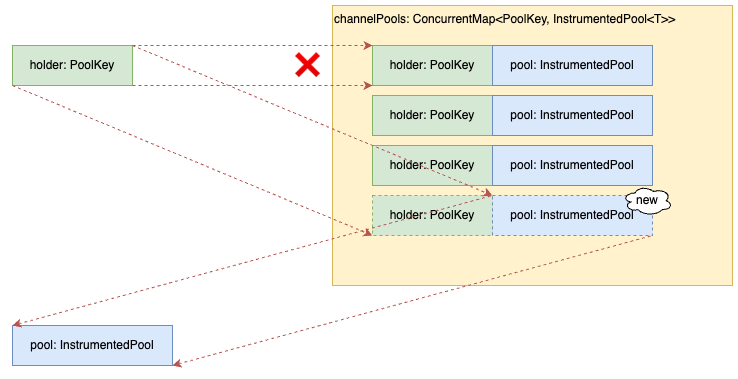
今回発生したケース(異常)
channelPoolsに存在する情報がキーとなるが、InstrumentedPoolが再利用されず新規作成されてしまう。
問題箇所の修正と検証
修正箇所
- 問題となっているLambda式をプロパティ呼び出しに書き換える
修正前
abstract class HttpSupport {
    ...
    private fun httpClient(connTimeout: Int, readTimeout: Int) = HttpClient.create()
        .proxyWithSystemProperties()
        .doOnChannelInit { _, channel, _ ->
            channel.config().connectTimeoutMillis = connTimeout
        }
        .responseTimeout(Duration.ofMillis(readTimeout.toLong()))
    ...
}
修正後
abstract class HttpSupport {
    ...
    private fun httpClient(connTimeout: Int, readTimeout: Int) = HttpClient.create()
        .proxyWithSystemProperties()
        .option(ChannelOption.CONNECT_TIMEOUT_MILLIS, connTimeout)
        .responseTimeout(Duration.ofMillis(readTimeout.toLong()))
    ...
}
検証
前提条件
MembersHttpSupport#members(memberId: String)を1000回呼び出す。PooledConnectionProvider#channelPoolsに格納されているオブジェクトの件数を確認する。
修正前の結果
- 修正前の状態で実行したところ、
PooledConnectionProvider#channelPoolsに1000個のオブジェクトが格納されていることが分かりました(リークの原因)。
修正後の結果
- 修正後の状態で実行したところ、
PooledConnectionProvider#channelPoolsに1個のオブジェクトが格納されていることが分かりました(リーク解消)。
まとめ
今回の調査では、KINTO FACTORYのWebサービスにおけるメモリリークの原因を特定し、適切な修正を行うことで問題を解決することができました。特に、外部API呼び出し時に大量のオブジェクトが新規作成されていたことがメモリリークの原因であると判明し、Lambda式をプロパティ呼び出しに変更することで解消されました。
このプロジェクトを通じて、以下の重要な教訓を得ることができました:
-
持続的なモニタリング:ECSサービスのCPU使用率の異常やFull GCの頻繁な発生を通じて、継続的なモニタリングの重要性を認識しました。システムのパフォーマンスを常に監視することで、問題の兆候を早期に察知し、迅速に対処することができます。
-
早期の問題特定と対策:Webサービスのメモリリークを疑い、長時間APIを呼び出してメモリ状況を再現させることで、外部サービスのリクエスト時に大量のオブジェクトが新規作成されていることを特定しました。これにより、問題の原因を迅速に特定し、適切な修正を実施できました。
-
チームワークの重要性:複雑な問題に対処する際には、チーム全員が協力して取り組むことが成功への鍵となります。今回の修正と検証は、開発チーム全員の協力と努力によって達成されました。特に、調査、分析、修正、検証といった各ステップでの協力が成果を上げました。
調査フェーズでは、多くの苦労がありました。例えば、メモリリークの再現がローカル環境では難しく、実際の環境に近い検証環境で再度検証を行う必要がありました。また、外部APIを長時間にわたって呼び出し続けることで、メモリリークを再現し、その原因を特定するのに多くの時間と労力を要しました。しかし、これらの困難を乗り越えることで、最終的には問題を解決することができ、大きな達成感を得ることができました。
この記事を通じて、システムのパフォーマンス向上と安定性を維持するための実践的なアプローチや教訓を共有しました。同様の問題に直面している開発者の方々の参考になれば幸いです。
以上です〜
関連記事 | Related Posts
Webサービスにおけるメモリリークの原因調査と解決
Getting Started with Prometheus, Grafana, and X-Ray for Observability (O11y)
A story about JavaScript error detection in browser
How We Reduced AWS Costs by 65%—and What We Discovered Beyond That

Improving CWV Scores Through Kaizen Day and Study Sessions
Building Cloud-Native Microservices with Kotlin/Ktor (Observability Edition)
We are hiring!
【クラウドエンジニア】Cloud Infrastructure G/東京・大阪・福岡
KINTO Tech BlogWantedlyストーリーCloud InfrastructureグループについてAWSを主としたクラウドインフラの設計、構築、運用を主に担当しています。
シニア/フロントエンドエンジニア(React/Typescript)/KINTO中古車開発G/東京・大阪・福岡
KINTO開発部KINTO中古車開発グループについて◉KINTO開発部 :66名 KINTO中古車開発G:9名★ KINTOプロダクトマネジメントG:3名 KINTOバックエンド開発G:16名 契約管理開発G :9名 KINTO開発推進G:8名 KINTOフロントエンド開発G...