Using Sloth to Monitor SLOs Easily
Self-introduction
Hello. I am Sora Watanabe, a member of the SRE Team in the Platform Group at KINTO Technologies Corporation (from now on, KINTO Technologies). We contribute to improving the reliability of our company’s services by leveraging our experience in application development, infrastructure setup, and CI/CD for web services.
Introduction
No matter how great a service is, realistically, there is no way that problems will never occur. In today’s service delivery landscape, it’s essential to proactively set targets for an acceptable number of issues, and, in some cases, share these expectations with users to build consensus.
Specifically, you define the levels of service using Service Level Indicators (SLIs), then set target values for them using Service Level Objectives (SLOs). Then, you obtain the users’ agreement to these target values through Service Level Agreements or SLAs.
Having set your SLOs, the next step is to monitor for target violations. An alert needs to be triggered if a violation occurs. However, the rules for triggering alerts are prone to getting complex and difficult to manage.
In order to solve this problem, in this article, I will introduce a way to streamline creating and managing alert rules by using an alert rule generator called Sloth.
Background
As I discussed in a previous article, at KINTO Technologies, we are using the stack “Prometheus + Grafana + X-Ray” to obtain telemetry data and improve the observability of our request-response-type web services.
Thanks to this, we are now successfully storing a wide variety of metrics in Prometheus, and for Spring Boot application metrics in particular, doing so without having to add any special instrumentation into the application code.
The metrics stored include the success/failure status and response rate data on a per-request basis. This has enabled us to express SLIs for availability and latency using PromQL.
Issues
Typically, after establishing SLIs and SLOs for the web service’s Critical User Journey (CUJ), you then monitor the error budget usage for the deployed service. When doing so, you need to detect potential SLO/SLA violations at an appropriate time. To do that, you need to set up alerts to enable the developers to detect anomalies.
According to The Site Reliability Workbook, multi-window, multi-burn-rate alerts are the most effective and recommended approach for detecting SLO violations. A key benefit is that they offer excellent control over precision, reproducibility, detection time, and reset time, making us eager to implement them actively.
I will briefly explain about what “window” and “burn rate” mean:
- Window
- This means the measurement periods. These are the timeframes defined for when measurement begins and ends. Since SLOs are expressed as percentages, the service level resets to 100% at the start of each new measurement period when the previous one concludes. In general, the larger the window size, the harder it is to trigger and end alerts.
- Burn rate
- This refers to the rate at which the error budget is used up. Triggering an alert only after the error budget is fully consumed would be too late; ideally, an alert should be triggered once a certain portion of it has been used. The burn rate is calculated by defining a reference value of 1, which represents the rate at which the error budget would reach exactly 0 by the end of the measurement window if consumed at a steady pace. Then, the actual consumption rate is measured against this reference to see how many times faster the error budget is being depleted. This multiple is recorded as the burn rate. You configure the system to trigger an alert when the burn rate surpasses a predetermined threshold.
For more information on multiwindow, multi-burn-rate alerts, see Chapter 5, “Alerting on SLOs” in The Site Reliability Workbook. https://www.oreilly.co.jp/books/9784873119137/ The English version has been published on the web: https://sre.google/workbook/alerting-on-slos/#6-multiwindow-multi-burn-rate-alerts
To use the multiwindow, multi-burn-rate alerts approach, you need to set up an alert rule that specifies multiple windows and burn rates—i.e., multiple different parameters—for a single SLI/SLO definition.
As a result, a challenge has been that the number of alert rules grows to the point where they become difficult to manage.
- This refers to the rate at which the error budget is used up. Triggering an alert only after the error budget is fully consumed would be too late; ideally, an alert should be triggered once a certain portion of it has been used. The burn rate is calculated by defining a reference value of 1, which represents the rate at which the error budget would reach exactly 0 by the end of the measurement window if consumed at a steady pace. Then, the actual consumption rate is measured against this reference to see how many times faster the error budget is being depleted. This multiple is recorded as the burn rate. You configure the system to trigger an alert when the burn rate surpasses a predetermined threshold.
What we will do
In this article, we will use an open source tool called Sloth to solve this issue.
By using Sloth, you can define SLI/SLO specifications with simple descriptions, which then generate Prometheus recording rules and alert rule definition files—tasks that would otherwise be complex and prone to errors.
At KINTO Technologies, we adopt a configuration like the one in the figure below.
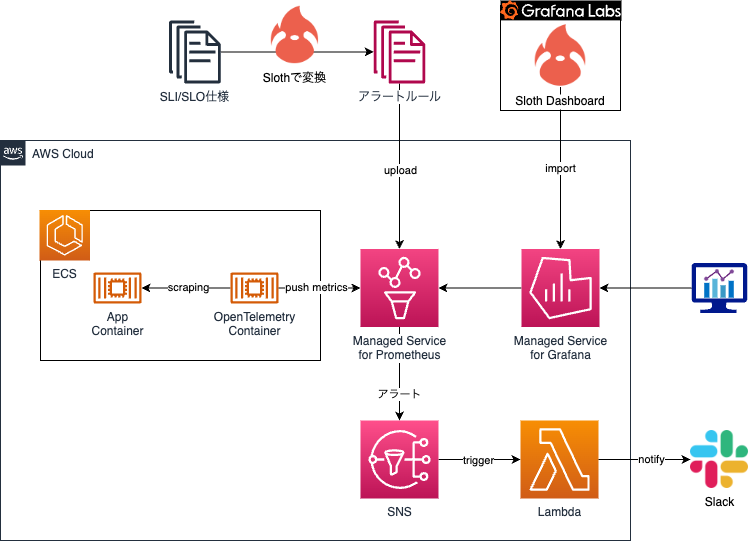
Sloth is able to generate multiwindow, multi-burn rate alert rules by default. Therefore, in this article, I will show you how to set up multiwindow, multi-burn rate alert rules using Sloth.
Generating alert rules
The following simple SLI/SLO specification is expressed in a YAML file based on the Sloth standards.
| Category | SLI | SLO |
|---|---|---|
| Availability | The percentage of successful requests measured by the application over a 30-day period. Consider any HTTP status outside the ranges 500–599 and 429 as successful. Consolidate and measure all request paths except actuator. | 99.5% |
version: "prometheus/v1"
service: "KINTO"
labels:
  owner: "KINTO Technologies Corporation"
  repo: "slo-maintenance"
  tier: "2"
slos:
  # We allow failing (5xx and 429) 5 request every 1000 requests (99.5%).
  - name: "kinto-requests-availability"
    objective: 99.5
    description: "Common SLO based on availability for HTTP request responses."
    sli:
      events:
        error_query: sum(rate(http_server_requests_seconds_count{application="kinto",status=~"(5..|429)",uri!~".*actuator.*"}[{{.window}}]))
        total_query: sum(rate(http_server_requests_seconds_count{application="kinto",uri!~".*actuator.*"}[{{.window}}]))
    alerting:
      name: KINTOHighErrorRate
      labels:
        category: "availability"
      annotations:
        # Overwrite default Sloth SLO alert summary on ticket and page alerts.
        summary: "High error rate on 'KINTO SERVICE' requests responses"
      page_alert:
        labels:
          severity: "critical"
      ticket_alert:
        labels:
          severity: "warning"
http_server_requests_seconds_count is a metric for when using Spring Boot. With this file saved in the ./source/ directory, run the following command:
docker pull ghcr.io/slok/sloth
docker run -v /$(pwd):/home ghcr.io/slok/sloth generate -i /home/source/slo_spec.yml > slo_generated_rules.yml
Running the above command generates the following files in the current directory. The generated files can be uploaded to Prometheus as is.
slo_generate_rules.yml
---
# Code generated by Sloth (a9d9dc42fb66372fb1bd2c69ca354da4ace51b65): https://github.com/slok/sloth.
# DO NOT EDIT.
groups:
- name: sloth-slo-sli-recordings-KINTO-kinto-requests-availability
  rules:
  - record: slo:sli_error:ratio_rate5m
    expr: |
      (sum(rate(http_server_requests_seconds_count{application="kinto",status=~"(5..|429)",uri!~".*actuator.*"}[5m])))
      /
      (sum(rate(http_server_requests_seconds_count{application="kinto",uri!~".*actuator.*"}[5m])))
    labels:
      owner: KINTO Technologies Corporation
      repo: slo-maintenance
      sloth_id: KINTO-kinto-requests-availability
      sloth_service: KINTO
      sloth_slo: kinto-requests-availability
      sloth_window: 5m
      tier: "2"
  - record: slo:sli_error:ratio_rate30m
    expr: |
      (sum(rate(http_server_requests_seconds_count{application="kinto",status=~"(5..|429)",uri!~".*actuator.*"}[30m])))
      /
      (sum(rate(http_server_requests_seconds_count{application="kinto",uri!~".*actuator.*"}[30m])))
    labels:
      owner: KINTO Technologies Corporation
      repo: slo-maintenance
      sloth_id: KINTO-kinto-requests-availability
      sloth_service: KINTO
      sloth_slo: kinto-requests-availability
      sloth_window: 30m
      tier: "2"
  - record: slo:sli_error:ratio_rate1h
    expr: |
      (sum(rate(http_server_requests_seconds_count{application="kinto",status=~"(5..|429)",uri!~".*actuator.*"}[1h])))
      /
      (sum(rate(http_server_requests_seconds_count{application="kinto",uri!~".*actuator.*"}[1h])))
    labels:
      owner: KINTO Technologies Corporation
      repo: slo-maintenance
      sloth_id: KINTO-kinto-requests-availability
      sloth_service: KINTO
      sloth_slo: kinto-requests-availability
      sloth_window: 1h
      tier: "2"
  - record: slo:sli_error:ratio_rate2h
    expr: |
      (sum(rate(http_server_requests_seconds_count{application="kinto",status=~"(5..|429)",uri!~".*actuator.*"}[2h])))
      /
      (sum(rate(http_server_requests_seconds_count{application="kinto",uri!~".*actuator.*"}[2h])))
    labels:
      owner: KINTO Technologies Corporation
      repo: slo-maintenance
      sloth_id: KINTO-kinto-requests-availability
      sloth_service: KINTO
      sloth_slo: kinto-requests-availability
      sloth_window: 2h
      tier: "2"
  - record: slo:sli_error:ratio_rate6h
    expr: |
      (sum(rate(http_server_requests_seconds_count{application="kinto",status=~"(5..|429)",uri!~".*actuator.*"}[6h])))
      /
      (sum(rate(http_server_requests_seconds_count{application="kinto",uri!~".*actuator.*"}[6h])))
    labels:
      owner: KINTO Technologies Corporation
      repo: slo-maintenance
      sloth_id: KINTO-kinto-requests-availability
      sloth_service: KINTO
      sloth_slo: kinto-requests-availability
      sloth_window: 6h
      tier: "2"
  - record: slo:sli_error:ratio_rate1d
    expr: |
      (sum(rate(http_server_requests_seconds_count{application="kinto",status=~"(5..|429)",uri!~".*actuator.*"}[1d])))
      /
      (sum(rate(http_server_requests_seconds_count{application="kinto",uri!~".*actuator.*"}[1d])))
    labels:
      owner: KINTO Technologies Corporation
      repo: slo-maintenance
      sloth_id: KINTO-kinto-requests-availability
      sloth_service: KINTO
      sloth_slo: kinto-requests-availability
      sloth_window: 1d
      tier: "2"
  - record: slo:sli_error:ratio_rate3d
    expr: |
      (sum(rate(http_server_requests_seconds_count{application="kinto",status=~"(5..|429)",uri!~".*actuator.*"}[3d])))
      /
      (sum(rate(http_server_requests_seconds_count{application="kinto",uri!~".*actuator.*"}[3d])))
    labels:
      owner: KINTO Technologies Corporation
      repo: slo-maintenance
      sloth_id: KINTO-kinto-requests-availability
      sloth_service: KINTO
      sloth_slo: kinto-requests-availability
      sloth_window: 3d
      tier: "2"
  - record: slo:sli_error:ratio_rate30d
    expr: |
      sum_over_time(slo:sli_error:ratio_rate5m{sloth_id="KINTO-kinto-requests-availability", sloth_service="KINTO", sloth_slo="kinto-requests-availability"}[30d])
      / ignoring (sloth_window)
      count_over_time(slo:sli_error:ratio_rate5m{sloth_id="KINTO-kinto-requests-availability", sloth_service="KINTO", sloth_slo="kinto-requests-availability"}[30d])
    labels:
      owner: KINTO Technologies Corporation
      repo: slo-maintenance
      sloth_id: KINTO-kinto-requests-availability
      sloth_service: KINTO
      sloth_slo: kinto-requests-availability
      sloth_window: 30d
      tier: "2"
- name: sloth-slo-meta-recordings-KINTO-kinto-requests-availability
  rules:
  - record: slo:objective:ratio
    expr: vector(0.995)
    labels:
      owner: KINTO Technologies Corporation
      repo: slo-maintenance
      sloth_id: KINTO-kinto-requests-availability
      sloth_service: KINTO
      sloth_slo: kinto-requests-availability
      tier: "2"
  - record: slo:error_budget:ratio
    expr: vector(1-0.995)
    labels:
      owner: KINTO Technologies Corporation
      repo: slo-maintenance
      sloth_id: KINTO-kinto-requests-availability
      sloth_service: KINTO
      sloth_slo: kinto-requests-availability
      tier: "2"
  - record: slo:time_period:days
    expr: vector(30)
    labels:
      owner: KINTO Technologies Corporation
      repo: slo-maintenance
      sloth_id: KINTO-kinto-requests-availability
      sloth_service: KINTO
      sloth_slo: kinto-requests-availability
      tier: "2"
  - record: slo:current_burn_rate:ratio
    expr: |
      slo:sli_error:ratio_rate5m{sloth_id="KINTO-kinto-requests-availability", sloth_service="KINTO", sloth_slo="kinto-requests-availability"}
      / on(sloth_id, sloth_slo, sloth_service) group_left
      slo:error_budget:ratio{sloth_id="KINTO-kinto-requests-availability", sloth_service="KINTO", sloth_slo="kinto-requests-availability"}
    labels:
      owner: KINTO Technologies Corporation
      repo: slo-maintenance
      sloth_id: KINTO-kinto-requests-availability
      sloth_service: KINTO
      sloth_slo: kinto-requests-availability
      tier: "2"
  - record: slo:period_burn_rate:ratio
    expr: |
      slo:sli_error:ratio_rate30d{sloth_id="KINTO-kinto-requests-availability", sloth_service="KINTO", sloth_slo="kinto-requests-availability"}
      / on(sloth_id, sloth_slo, sloth_service) group_left
      slo:error_budget:ratio{sloth_id="KINTO-kinto-requests-availability", sloth_service="KINTO", sloth_slo="kinto-requests-availability"}
    labels:
      owner: KINTO Technologies Corporation
      repo: slo-maintenance
      sloth_id: KINTO-kinto-requests-availability
      sloth_service: KINTO
      sloth_slo: kinto-requests-availability
      tier: "2"
  - record: slo:period_error_budget_remaining:ratio
    expr: 1 - slo:period_burn_rate:ratio{sloth_id="KINTO-kinto-requests-availability",
      sloth_service="KINTO", sloth_slo="kinto-requests-availability"}
    labels:
      owner: KINTO Technologies Corporation
      repo: slo-maintenance
      sloth_id: KINTO-kinto-requests-availability
      sloth_service: KINTO
      sloth_slo: kinto-requests-availability
      tier: "2"
  - record: sloth_slo_info
    expr: vector(1)
    labels:
      owner: KINTO Technologies Corporation
      repo: slo-maintenance
      sloth_id: KINTO-kinto-requests-availability
      sloth_mode: cli-gen-prom
      sloth_objective: "99.5"
      sloth_service: KINTO
      sloth_slo: kinto-requests-availability
      sloth_spec: prometheus/v1
      sloth_version: a9d9dc42fb66372fb1bd2c69ca354da4ace51b65
      tier: "2"
- name: sloth-slo-alerts-KINTO-kinto-requests-availability
  rules:
  - alert: KINTOHighErrorRate
    expr: |
      (
          max(slo:sli_error:ratio_rate5m{sloth_id="KINTO-kinto-requests-availability", sloth_service="KINTO", sloth_slo="kinto-requests-availability"} > (14.4 * 0.005)) without (sloth_window)
          and
          max(slo:sli_error:ratio_rate1h{sloth_id="KINTO-kinto-requests-availability", sloth_service="KINTO", sloth_slo="kinto-requests-availability"} > (14.4 * 0.005)) without (sloth_window)
      )
      or
      (
          max(slo:sli_error:ratio_rate30m{sloth_id="KINTO-kinto-requests-availability", sloth_service="KINTO", sloth_slo="kinto-requests-availability"} > (6 * 0.005)) without (sloth_window)
          and
          max(slo:sli_error:ratio_rate6h{sloth_id="KINTO-kinto-requests-availability", sloth_service="KINTO", sloth_slo="kinto-requests-availability"} > (6 * 0.005)) without (sloth_window)
      )
    labels:
      category: availability
      severity: critical
      sloth_severity: page
    annotations:
      summary: High error rate on 'KINTO SERVICE' requests responses
      title: (page) {{$labels.sloth_service}} {{$labels.sloth_slo}} SLO error budget
        burn rate is too fast.
  - alert: KINTOHighErrorRate
    expr: |
      (
          max(slo:sli_error:ratio_rate2h{sloth_id="KINTO-kinto-requests-availability", sloth_service="KINTO", sloth_slo="kinto-requests-availability"} > (3 * 0.005)) without (sloth_window)
          and
          max(slo:sli_error:ratio_rate1d{sloth_id="KINTO-kinto-requests-availability", sloth_service="KINTO", sloth_slo="kinto-requests-availability"} > (3 * 0.005)) without (sloth_window)
      )
      or
      (
          max(slo:sli_error:ratio_rate6h{sloth_id="KINTO-kinto-requests-availability", sloth_service="KINTO", sloth_slo="kinto-requests-availability"} > (1 * 0.005)) without (sloth_window)
          and
          max(slo:sli_error:ratio_rate3d{sloth_id="KINTO-kinto-requests-availability", sloth_service="KINTO", sloth_slo="kinto-requests-availability"} > (1 * 0.005)) without (sloth_window)
      )
    labels:
      category: availability
      severity: warning
      sloth_severity: ticket
    annotations:
      summary: High error rate on 'KINTO SERVICE' requests responses
      title: (ticket) {{$labels.sloth_service}} {{$labels.sloth_slo}} SLO error budget
        burn rate is too fast.
This time, we generated a simple example, but in practice, you’ll likely define multiple, more complex SLI/SLO specifications. Without Sloth, you would need to manage lengthy, generated-like code directly. Sloth significantly reduces the hassle involved in this process
Configuration procedure
At KINTO Technologies, we use Amazon Managed Service for Prometheus. This enables you to upload the generated files via the AWS Managed Console.
For more information on how to use Amazon Managed Service for Prometheus, please refer to the official documentation:
Alternatively, you can run the AWS CLI from a workflow. Here is an example using GitHub Actions.
name: SLO set up
on:
  workflow_dispatch:
jobs:
  setup-slo:
    name: Set up SLOs
    runs-on: ubuntu-latest
    steps:
      - uses: actions/checkout@v3
      - name: Set AWS Credentials to EnvParam(Common)
        uses: aws-actions/configure-aws-credentials@v2
        with:
          aws-access-key-id: ${{ AWS access key to be used }}
          aws-secret-access-key: ${{ AWS secret access key to be used }}
          aws-region: ${{ AWS region to be used }}
      ## Generate a configuration file from the definition file
      - name: download and setup generator binary
        run: |
          ## Please check the latest release situation as appropriate.
          wget https://github.com/slok/sloth/releases/download/vX.XX.X/sloth-linux-amd64
          chmod +x sloth-linux-amd64
          ./sloth-linux-amd64 validate -i ./services/kinto/source/slo_spec.yml
          ./sloth-linux-amd64 generate -i ./services/kinto/source/slo_spec.yml -o ./services/kinto/configuration.yml
      ## Upload the configuration file to Prometheus
      - name: upload configuration file to APM
        run: |
          base64 ./services/kinto/configuration.yml > ./services/kinto/configuration_base_64.yml
          aws amp create-rule-groups-namespace \
            --data file://./services/kinto/configuration_base_64.yml \
            --name slo-rules \
            --workspace-id ${{ ID of the AMP workspace to be used }} ¥
            --region ${{ AWS region to be used }}
Visual representation
Once the rule file has been uploaded to Prometheus, the next step is to represent the data visually. We use Grafana. Grafana Labs provides a dashboard template for Sloth, allowing you to visually represent the generated rules by simply importing it.
Procedure for configuring alerts
Multiwindow, multi-burn rate alerts are sent from Prometheus. Create an Alert manager configuration file and upload it to Prometheus.
:::message With “Amazon Managed Service for Prometheus,” only notifications to Amazon SNS are currently supported. (We are hoping this will improve in the future!) Consequently, we create SNS topics in advance, then specify the topics’ ARNs in the configuration file. :::
At KINTO Technologies, we create a configuration file similar to the following to separate the routing of Critical and Warning alerts. The SNS attributes sent include the alert type information.
alertmanager_config: |
  # The root route on which each incoming alert enters.
  route:
    # A default receiver
    receiver: warning_alert
    routes:
      - receiver: critical_alert
        matchers:
        - severity="critical"
      - receiver: warning_alert
        matchers:
        - severity="warning"
  # Amazon Managed Service for Prometheus,
  # The only receiver currently supported is Amazon Simple Notification Service (Amazon SNS).
  # If you have other types of receivers listed in the configuration, it will be rejected.
  # Expect future revisions. https://docs.aws.amazon.com/ja_jp/prometheus/latest/userguide/AMP-alertmanager-config.html
  receivers:
    - name: critical_alert
      sns_configs:
        - topic_arn: arn:aws:sns:{AWS region}:{AWS account}:prometheus-alertmanager
          sigv4:
            region: {AWS region}
          attributes:
            severity: critical
            slack_api_url: '<your slack api url>'
            slack_channel: '#<your channel name>'
    - name: warning_alert
      sns_configs:
        - topic_arn: arn:aws:sns:{AWS region}:{AWS account}:prometheus-alertmanager
          sigv4:
            region: {AWS region}
          attributes:
            severity: warning
            slack_api_url: '<your slack api url>'
            slack_channel: '#<your channel name>'
Also, we subscribe to the SNS topics on AWS Lambda. Lambda uses the attributes from the triggered notification to dynamically route the alerts to the appropriate Slack channels. In practice, we will customize this more, for example, by making it hit the PagerDuty API if a Critical alert is triggered.
#
# this script based on https://aws.amazon.com/jp/premiumsupport/knowledge-center/sns-lambda-webhooks-chime-slack-teams/
#
import urllib3
import json
http = urllib3.PoolManager()
def lambda_handler(event, context):
    print({"severity": event["Records"][0]["Sns"]["MessageAttributes"]["severity"]["Value"]})
    url = event["Records"][0]["Sns"]["MessageAttributes"]["slack_api_url"]["Value"]
    msg = {
        "channel": event["Records"][0]["Sns"]["MessageAttributes"]["slack_channel"]["Value"],
        "username": "PROMETHEUS_ALERTMANAGER",
        "text": event["Records"][0]["Sns"]["Message"],
        "icon_emoji": "",
    }
    encoded_msg = json.dumps(msg).encode("utf-8")
    resp = http.request("POST", url, body=encoded_msg)
    print(
        {
            "message": event["Records"][0]["Sns"]["Message"],
            "status_code": resp.status,
            "response": resp.data,
        }
    )
Neat approaches we came up with
SLOs as Code
With Sloth, you can encode SLI/SLO specifications in the YAML file format. Since this is code, the version can be managed using tools like Git. In addition, you can use hosting tools such as GitHub to make it easier to review. As long as the SLI/SLO specifications are compatible with Prometheus (expressible using PromQL), they can be applied not only to applications but also to metrics monitoring for load balancers and external monitoring services. So, it is fair to say that Sloth has a wide scope of application.
In the KINTO Technologies SRE Team, we consolidate all the YAML-format SLI/SLO specifications into a single GitHub repository. The SRE team provides a template in the repository, and the development teams define SLI/SLO specifications based on that, commit them, then create a pull request. The SRE team then reviews the pull request. This procedure makes it possible to understand the SLI/SLO specifications and reflect them in the monitoring smoothly.
This approach helps reduce management costs and allows SLOs for any product to be more easily referenced across KINTO Technologies’ entire development organization.
The service level of a dependency has a significant impact on the service level of its own service. Since KINTO Technologies' services rely on each other, sharing service levels across organizational boundaries helps maintain the service levels of individual services more effectively.
Latency SLI
With "slow being the new down," we need to monitor response times in addition to tracking 5xx errors. We will represent the following simple SLI/SLO specification in a YAML file that follows the Sloth standards.
| Category | SLI | SLO |
|---|---|---|
| Latency | Among the successful requests measured by the application, consolidate and measure all request paths except actuator. Among 30 days’ worth of requests, the percentage of those that return a response in less than 3,000 milliseconds. | 99% |
version: "prometheus/v1"
service: "KINTO"
labels:
  owner: "KINTO Technologies Corporation"
  repo: "slo-maintenance"
  tier: "2"
slos:
  ...
  # We allow failing (less than 3000ms) and (5xx and 429) 990 request every 1000 requests (99%).
  - name: "kinto-requests-latency-99percent-3000ms"
    objective: 99
    description: "Common SLO based on latency for HTTP request responses."
    sli:
      raw:
        # Get the average satisfaction ratio and rest 1 (max good) to get the error ratio.
        error_ratio_query: |
          1 - (
            sum(rate(http_server_requests_seconds_bucket{le="3",application="kinto",status!~"(5..|429)",uri!~".*actuator.*"}[{{.window}}]))
            /
            sum(rate(http_server_requests_seconds_count{application="kinto",status!~"(5..|429)",uri!~".*actuator.*"}[{{.window}}]))
          )
    alerting:
      name: KINTOHighErrorRate
      labels:
        category: "latency"
      annotations:
        summary: "High error rate on 'kinto service' requests responses"
      page_alert:
        labels:
          severity: "critical"
      ticket_alert:
        labels:
          severity: "warning"
To get the data in histogram form, add the following settings to application.yml:
management:
  ...
  metrics:
    tags:
      application: ${spring.application.name}
    distribution:
      percentiles-histogram:
        http:
          server:
            requests: true
      slo:
        http:
          server:
            requests: 100ms, 500ms, 3000ms
Adding the settings below management.metrics.distribution configures it to give the metrics via the histogram-type percentages-histogram rather than the summary-type percentiles.
The reason for this is that percentiles aggregate response times for a specific percentile only on a per-task basis and for the last minute, meaning they cannot be aggregated across multiple tasks or over an extended period, like 30 days. On the other hand, percentiles-histogram stores the number of requests with response times within the threshold as a value, so they can be aggregated for an arbitrary range across multiple tasks using PromQL.
This approach allows us to define the latency SLI specification as the percentage of total requests that meet the specified criteria.
Discussion
Recommendation for a settable SLO: At least 94%
The Site Reliability Workbook provides recommended window and burn rate thresholds for detecting error budget consumption.
By default, Sloth supports several of the burn rates given in the Site Reliability Workbook. Consequently, the maximum burn rate threshold for which alerts can occur is 14.4.
In this case, for example, if the SLO is 93%, the error budget will be 7%. If we calculate the error rate for a burn rate of 14.4, we get 14.4 * 7 = 100.8. Basically, the error rate is calculated using “error requests divided by all requests,” so it cannot exceed 100. This means that if you set the SLO to 93%, there is zero probability that an alert will be fired that reports a burn rate above 14.4.
Consequently, we recommend setting an SLO of at least 94%.
Conclusion
In my previous articles, I’ve shared the initiatives we’re working on within the KINTO Technologies SRE Team. What did you think?
While the organization as a whole isn’t required to manage service levels with extreme rigor, we’re pleased to have the flexibility to easily test useful alerts using the techniques described here.
The Platform Group is actively looking for new team members to join us If you are interested and would like to hear more, please feel free to contact us!
関連記事 | Related Posts


We are hiring!
【PdM】契約管理システム開発G/東京
契約管理システム開発グループについて契約管理システム開発グループは、クルマのサブスクリプションサービス『KINTO』(新車・中古車)を中心とした国内向けサービスにおいて、申込から契約満了(中途解約を含む)までの社内業務プロセスのシステム化と、契約状態の管理を担っています。
【クラウドセキュリティエンジニア】クラウドセキュリティG/東京・名古屋・大阪・福岡
ミッションクラウドセキュリティの専門組織として、KINTO テクノロジーズのマルチクラウド環境のセキュリティガバナンスに責任を持ちます。 セキュリティリスクを発生させない セキュリティリスクを常に監視・分析する セキュリティリスクが発生したときに速やかに対応する 業務内容ミッションを達成するために様々な業務を実施します。