Microsoft Clarityを導入してみた
はじめに
グローバル開発グループのWuです。普段Web/Portalのプロジェクトマネージメントの仕事をしています。
最近ボクシングジムにまた通い始めました。筋トレとダイエットを頑張っていきたいです!
私たち開発しているWebサイトにMicrosoftのClarityというヒートマップツールを導入したので、そちらについてお話します。
導入背景
モビリティサービスKINTOのグローバル展開を紹介するGlobal KINTO Webでは、ユーザーのページ滞在時間が短かったり、直帰率が高いなどの課題を抱えています。Googleアナリティクスのイベントでスクロール率やクリック率を数値でチェックしていますが、ユーザーの行動、ユーザーの興味関心はどこにあるのかはGoogleアナリティクスだけではわかりません。
そこで、ユーザーの行動をチェックし、簡単に課題を発見できるような分析ツールを導入することになりました。
Microsoft Clarityを選んだ理由
前述の通り、Global KINTO Webは現時点では比較的小規模なWebサイトで、また、サービスサイトではありません。その費用対効果を考えると、できるだけ安価でかつ簡単に導入できるヒートマップツールである必要がありました。
人気ツールUser Heat, ミエルカヒートマップ、mouseflow、User Insightなどのツールを検討しましたが、その中でもClarityを選定した理由は複数あります。
まず、KINTOテクノロジーズがすでに導入しているMicrosoftが提供していること、そして完全に無料であること、また、チームメンバーに権限を付与してチームで運用することもできること。また、セットアップも簡単で、導入までエンジニアの工数がほぼかからないのも魅力でした。
人気ツールの比較表
| ツール | 機能 | 導入方法 | プライス |
|---|---|---|---|
| Microsoft Clarity | ・インスタントヒートマップ:ユーザーがどこクリックしたか、どのぐらいスクロールしたか ・セッションのレコーディング可能(←かなり使える) ・レコーディング ・Google Analytics連携 |
Clarityがが提供しているHTMLタグをウェブサイトに埋め込む | 無料 |
| User Heat | ・マウスフローヒートマップ ・スクロールヒートマップ ・クリックヒートマップ ・アテンションヒートマップ |
User Heatがが提供しているHTMLタグをウェブサイトに埋め込む | 無料 |
| ミエルカヒートマップ | ・3つのヒートマップ機能 ・広告分析機能 ・イベントセグメント機能 ・ABテスト機能 ・IP除外機能 ・カスタマーエクスペリエンス改善チャート |
・フリープラン:3,000PV/月 ・有料プランはABテストなど使えるのでオプション性 |
|
| mouseflow | ・基本は上記の機能があるが、ファネルの設定、コンバージョンユーザーの分析など充実 ・レコーディング機能 ・フォームの分析機能(入力時間、送信数、離脱数など細かいみれる) |
mouseflowのトラッキングコードをエントランスウェブに埋め込む | Starterプラン(11,000/月)〜エンタープライズプラン |
Microsoft Clarityとは?
2020年10月29日リリースされた、Microsoftが提供する無料のヒートマップツールです。公式サイトより下記のとおり紹介されています。
セッション再生やヒートマップなどの機能を使用して、ユーザーの Web サイトとの対話方法を解釈できるようになるユーザー行動分析ツールです。
Microsoft Clarity
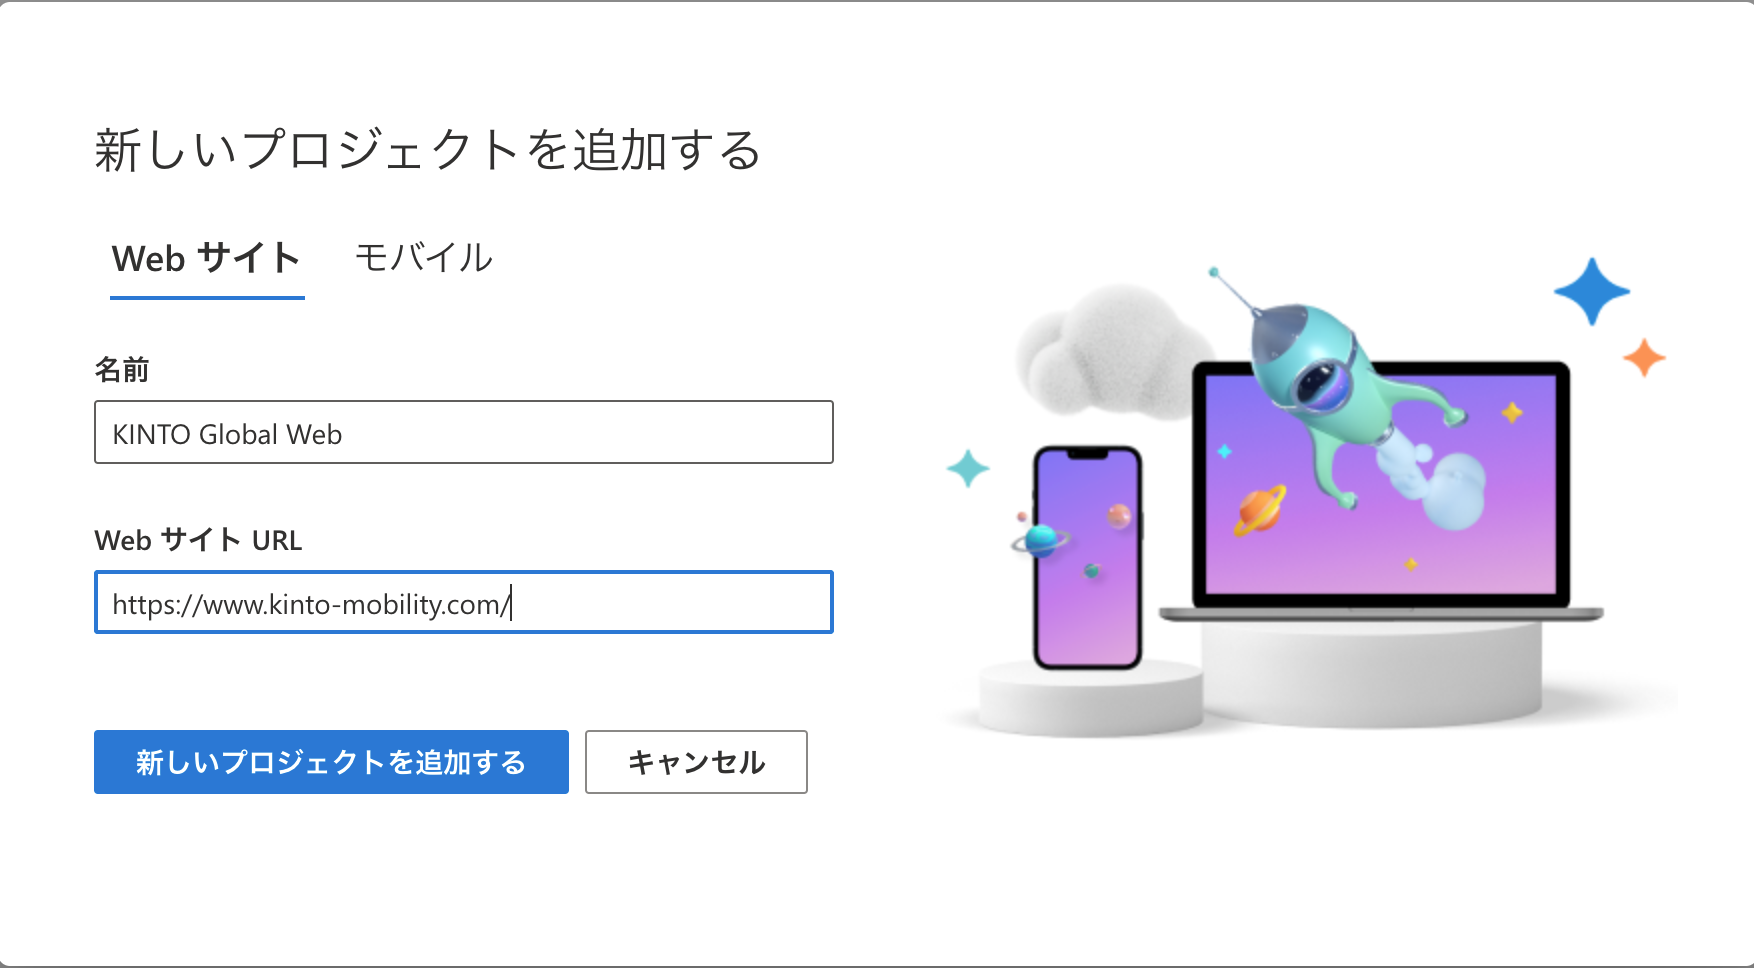
セットアップ
-
Clarityで新しいProjectを作成します
-
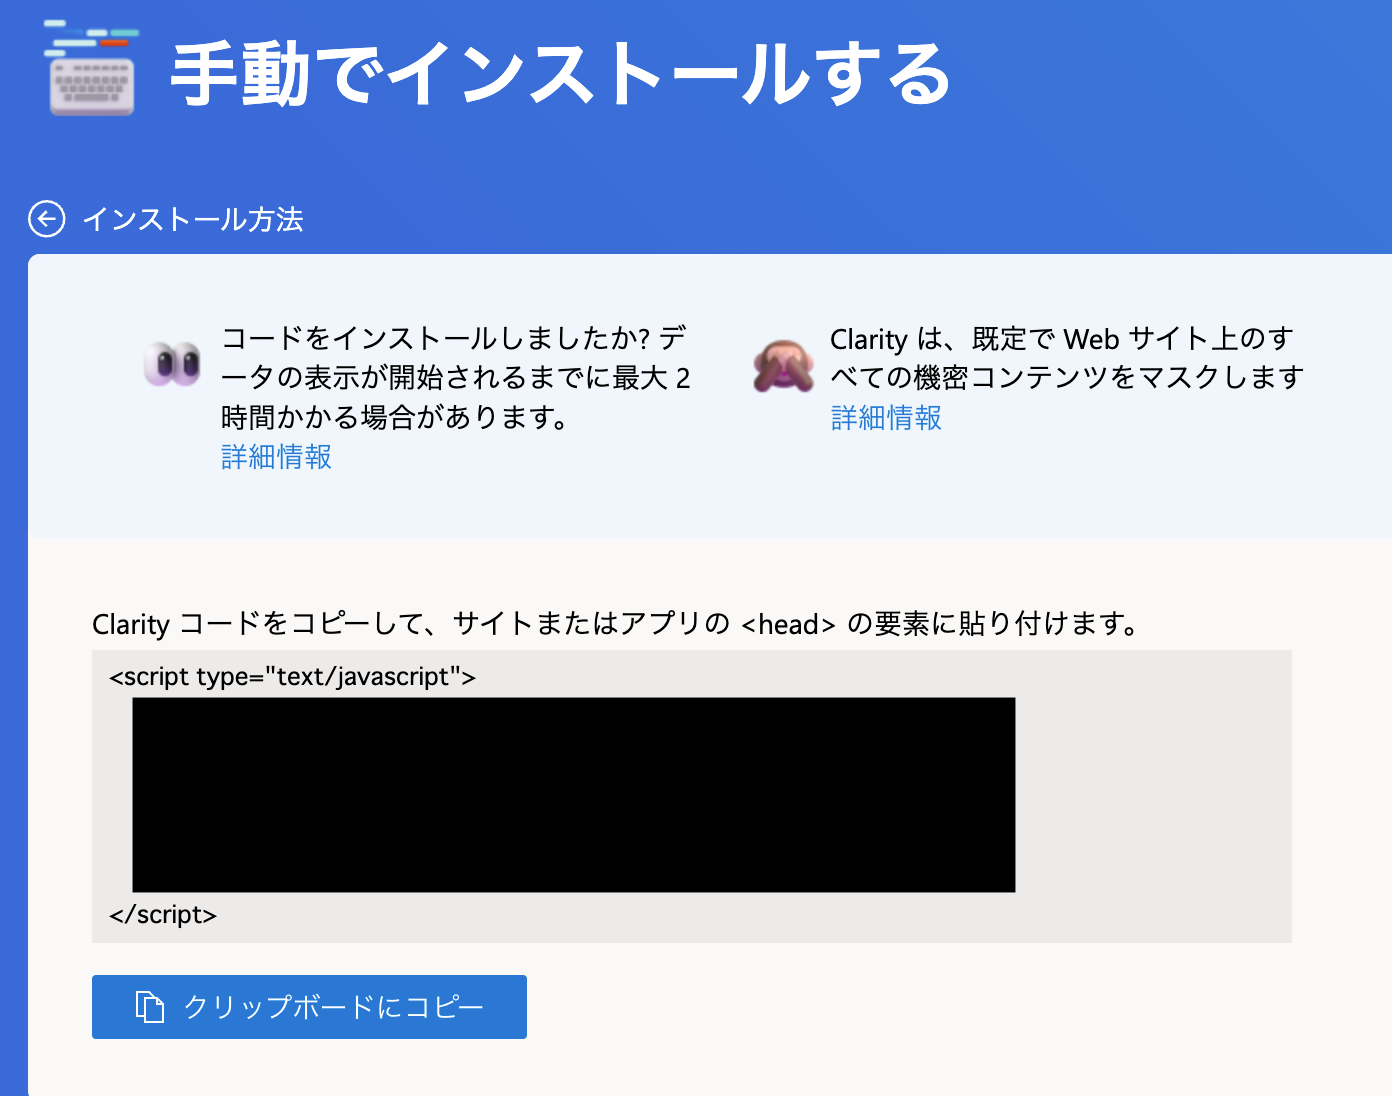
Clarityのトラッキングコードをページ内のheaderの要素に貼り付けます
-
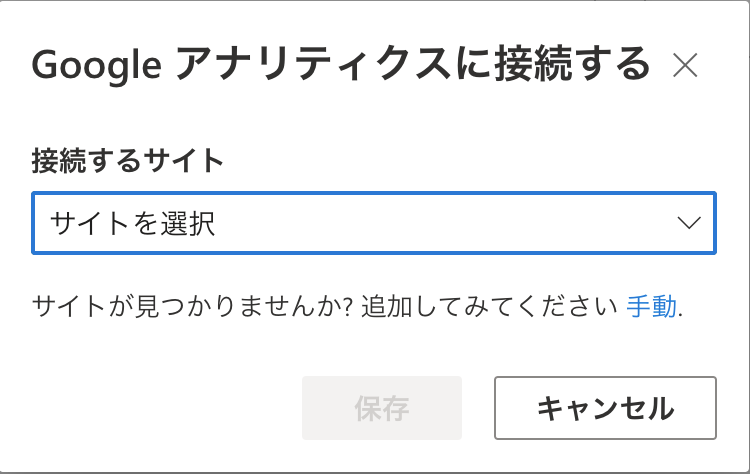
Googleアナリティクスを連携します
Dashboard
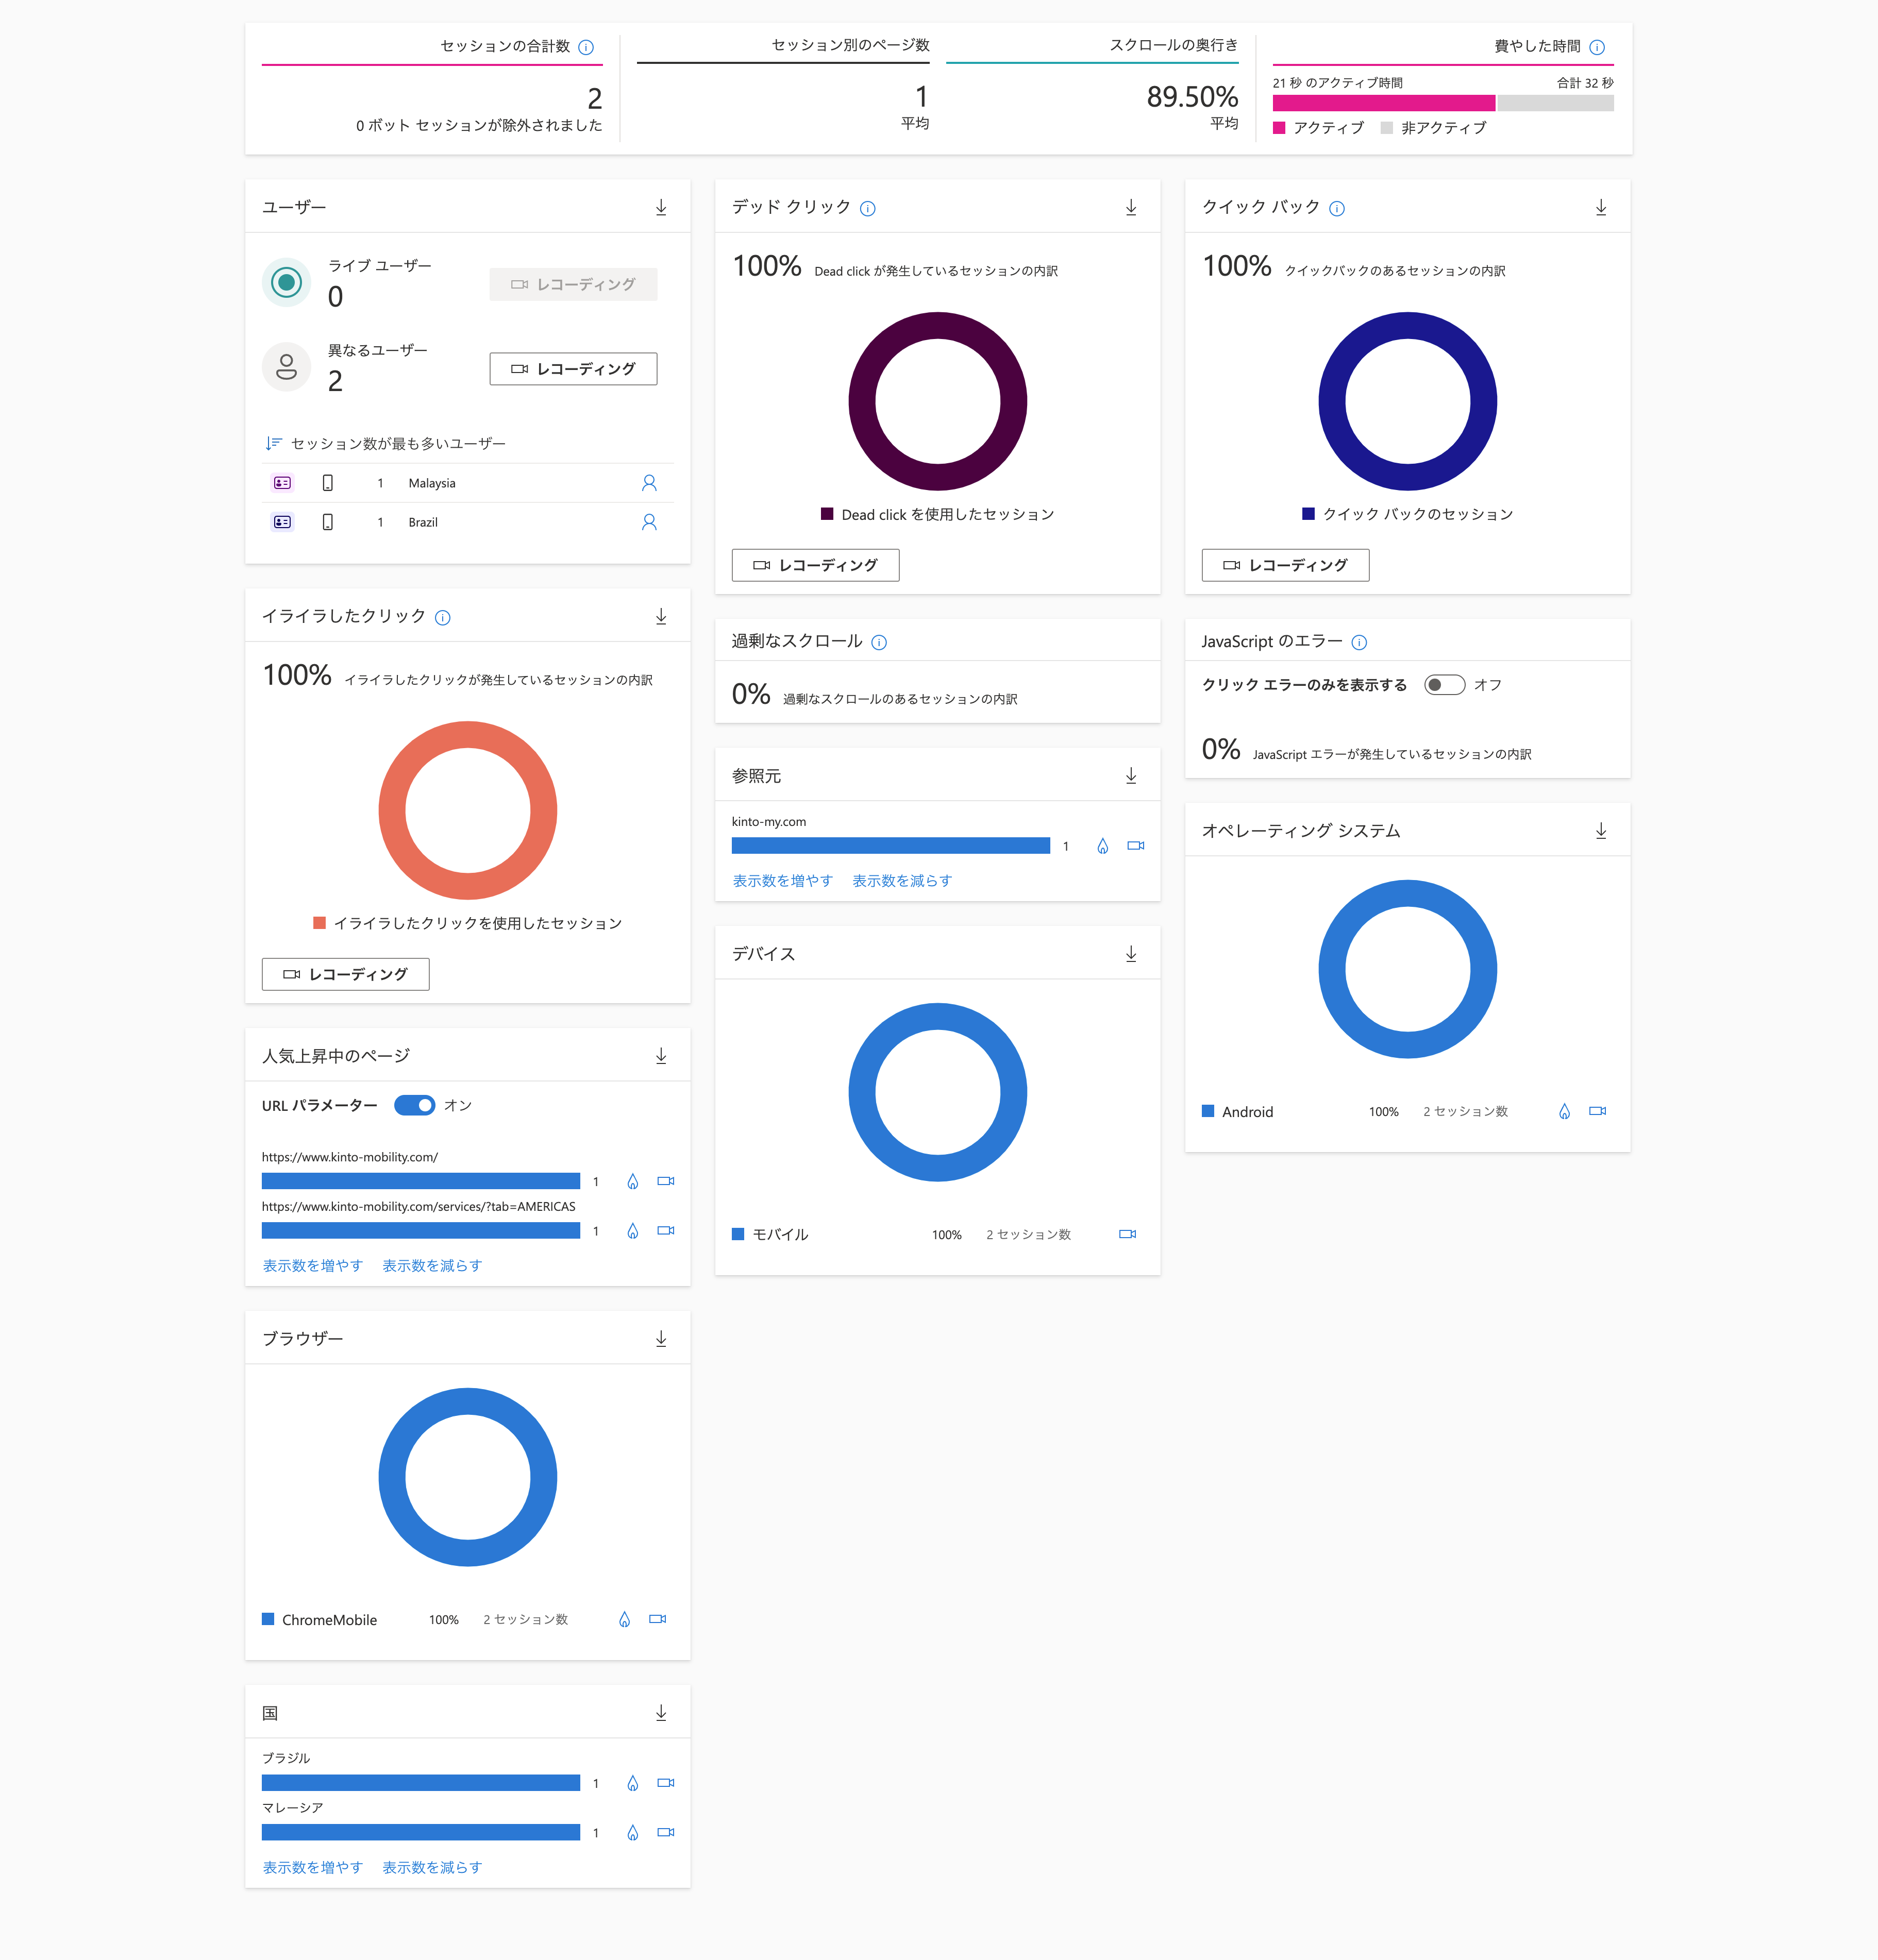
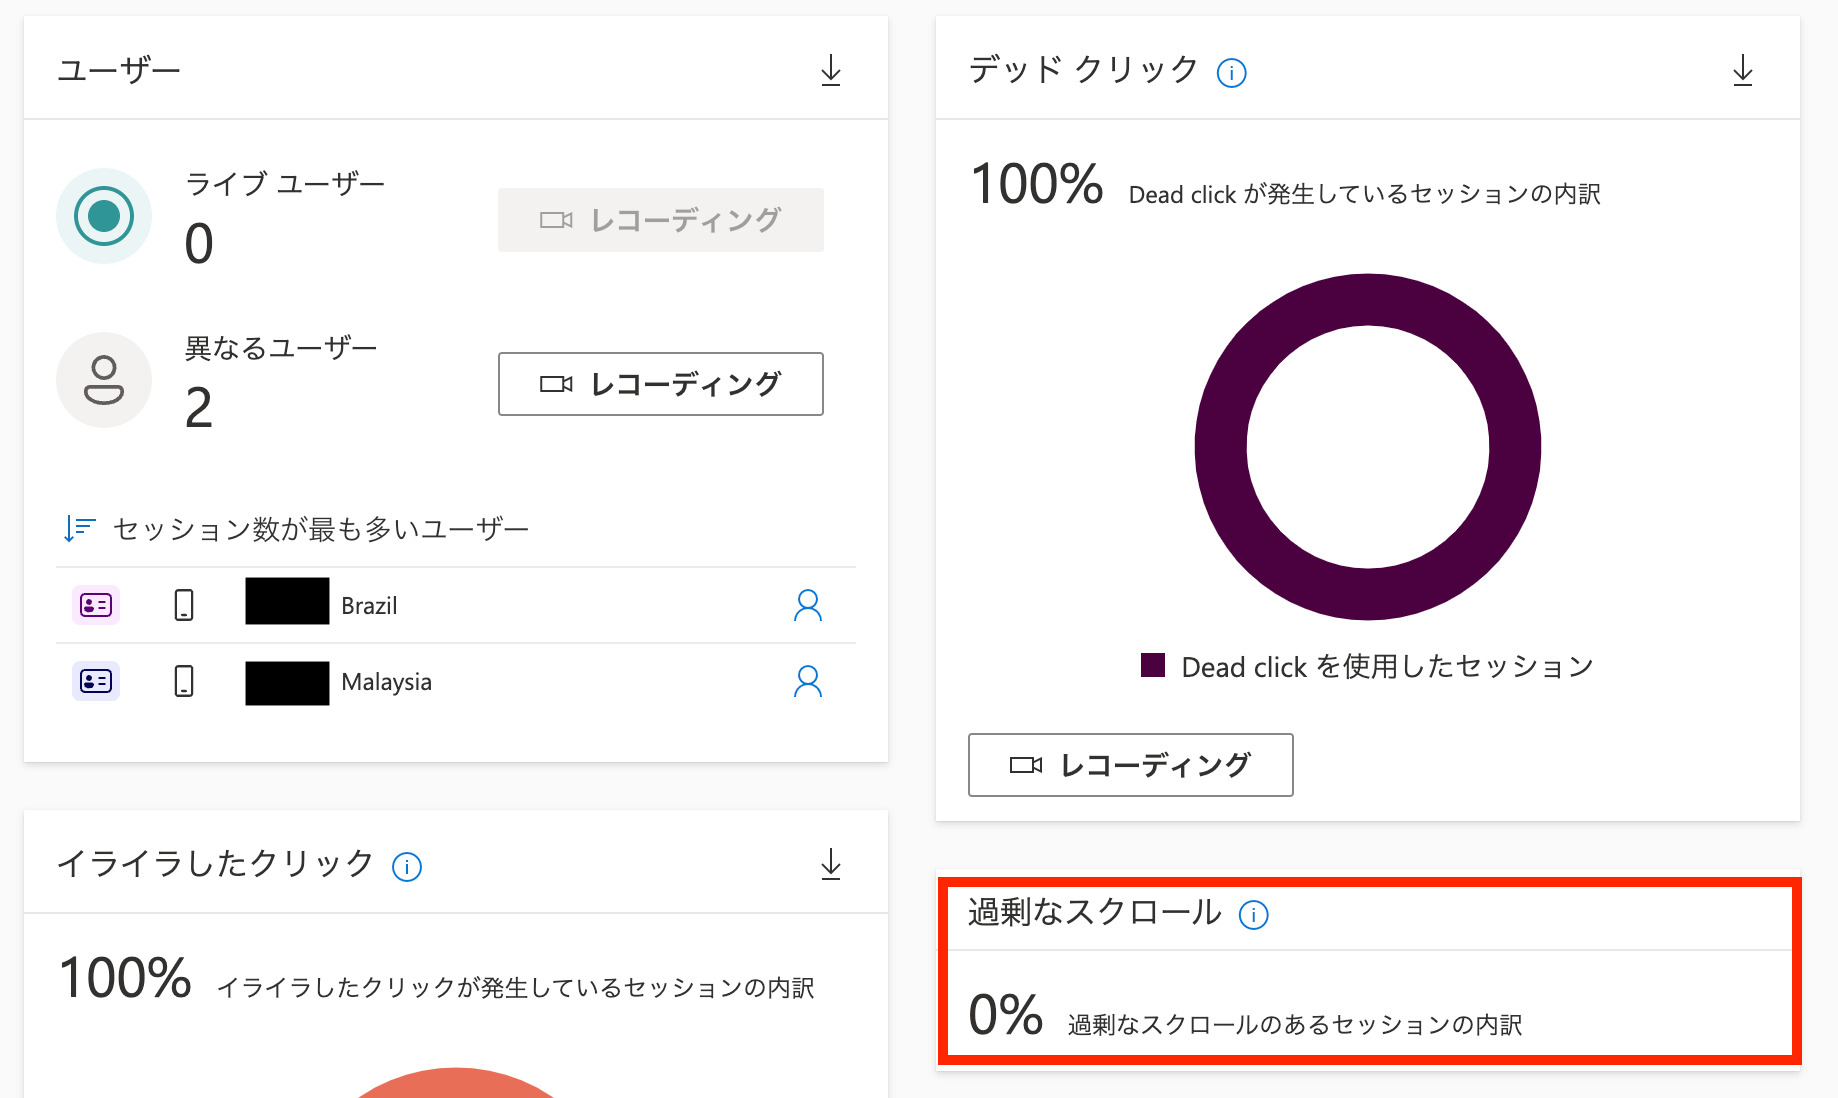
Dash boardはデッドクリック(Dead click)、クイックバック(Quick Back)、イライラしたクリック(Rage clicks)、過剰なスクロール(Excessive scrolling)などの分析といったようにサイトの状況がわかりやすく独自の項目がダッシュボード化されています。
デッドクリック(Dead click)
ユーザーがページ内のどこかをクリックまたはタップしたけれど、応答が検出されなかったという意味です。
Dead Clicks
ユーザーがどこをクリックしたのかがわかります。また、動画でユーザーの動きを記録しているのでわかりやすいです。
Global KINTO Webの場合、各サービスを紹介するパネルがよくクリックされ、ユーザーがより詳細な情報を求めていることが推測できます。
クイックバック(Quick Back)
ユーザーがページを表示した後、前のページに素早く戻ったという意味です。ユーザーがWebにアクセスした際、ターゲットではないページと判断したらすぐに前のページに戻ってしまう、または誤ってクリックしてアクセスしてしまったケースもあります。どの部分が利便性の低いナビゲーションになっているか、また、誤ってクリックされやすいかがわかります。
イライラしたクリック(Rage clicks)
ユーザーが同じ領域を何度もクリックまたはタップしたという意味です。
Rage Clicks
Global KINTO Webの場合、通信速度が遅いなどの原因でリンク集をひたすらクリックしているユーザーが複数人がいました。確認すると、同じOSのユーザーにこの事象が発生していることがわかったので、端末検証に繋がりました。
過剰なスクロール(Excessive scrolling)
ユーザーが想定以上にページをスクロールしたという意味です。ユーザーがページ内のコンテンツをしっかり読んでいない割合がわかる指標です。
Excessive scrolling
ヒートマップ
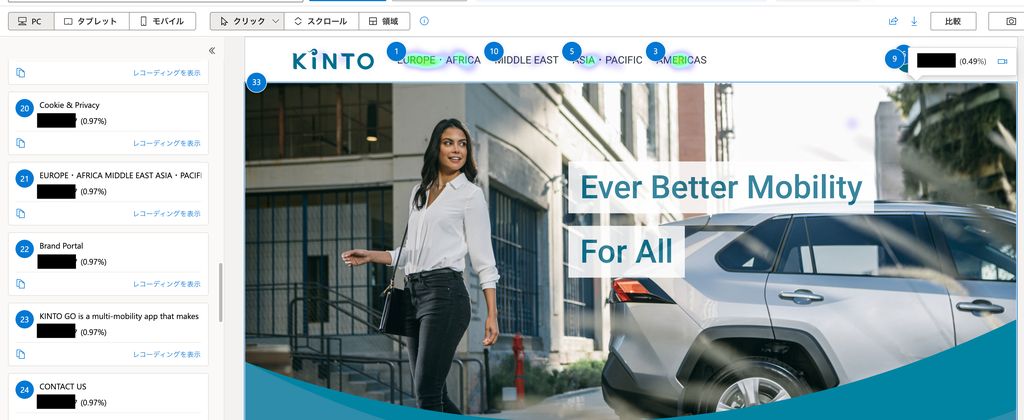
クリックヒートマップ(Click Heatmap)
ユーザーがページ内のどこを何回クリックしたかがわかります。左側のメニューにクリックされている箇所が多い順でランキングしています。
Click maps
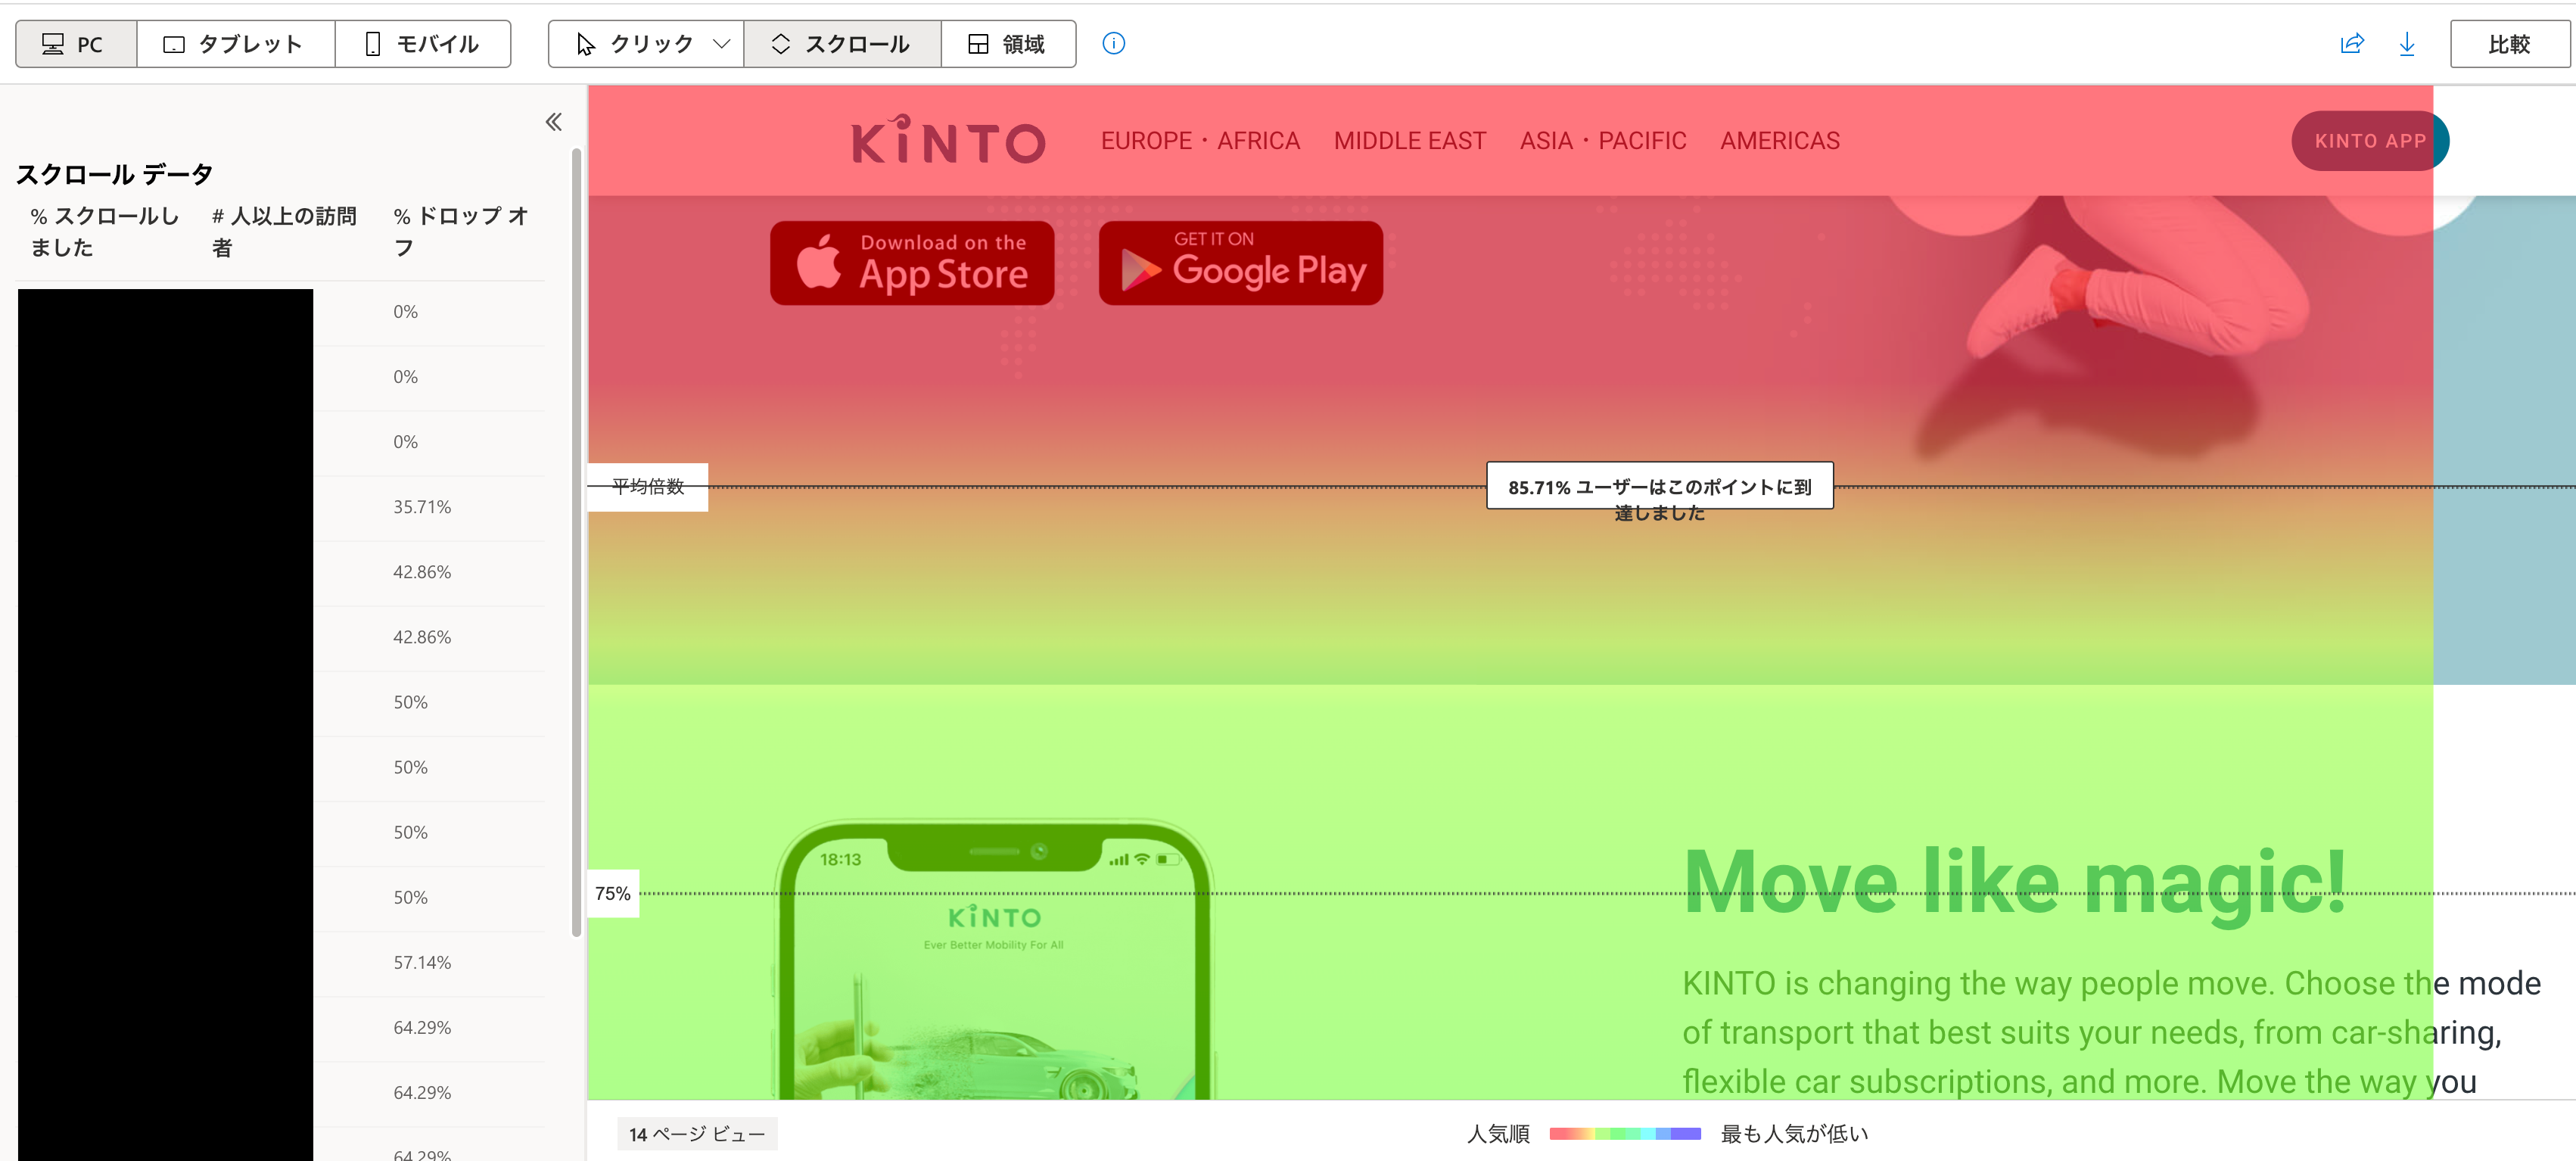
スクロールヒートマップ(Scroll Heatmap)
ユーザーがページをどこまで見てるかがわかります。赤い部分は最も読まれている箇所から、色がオレンジ、緑、青に見られてる割合の少ない順に変わります。
Scroll maps
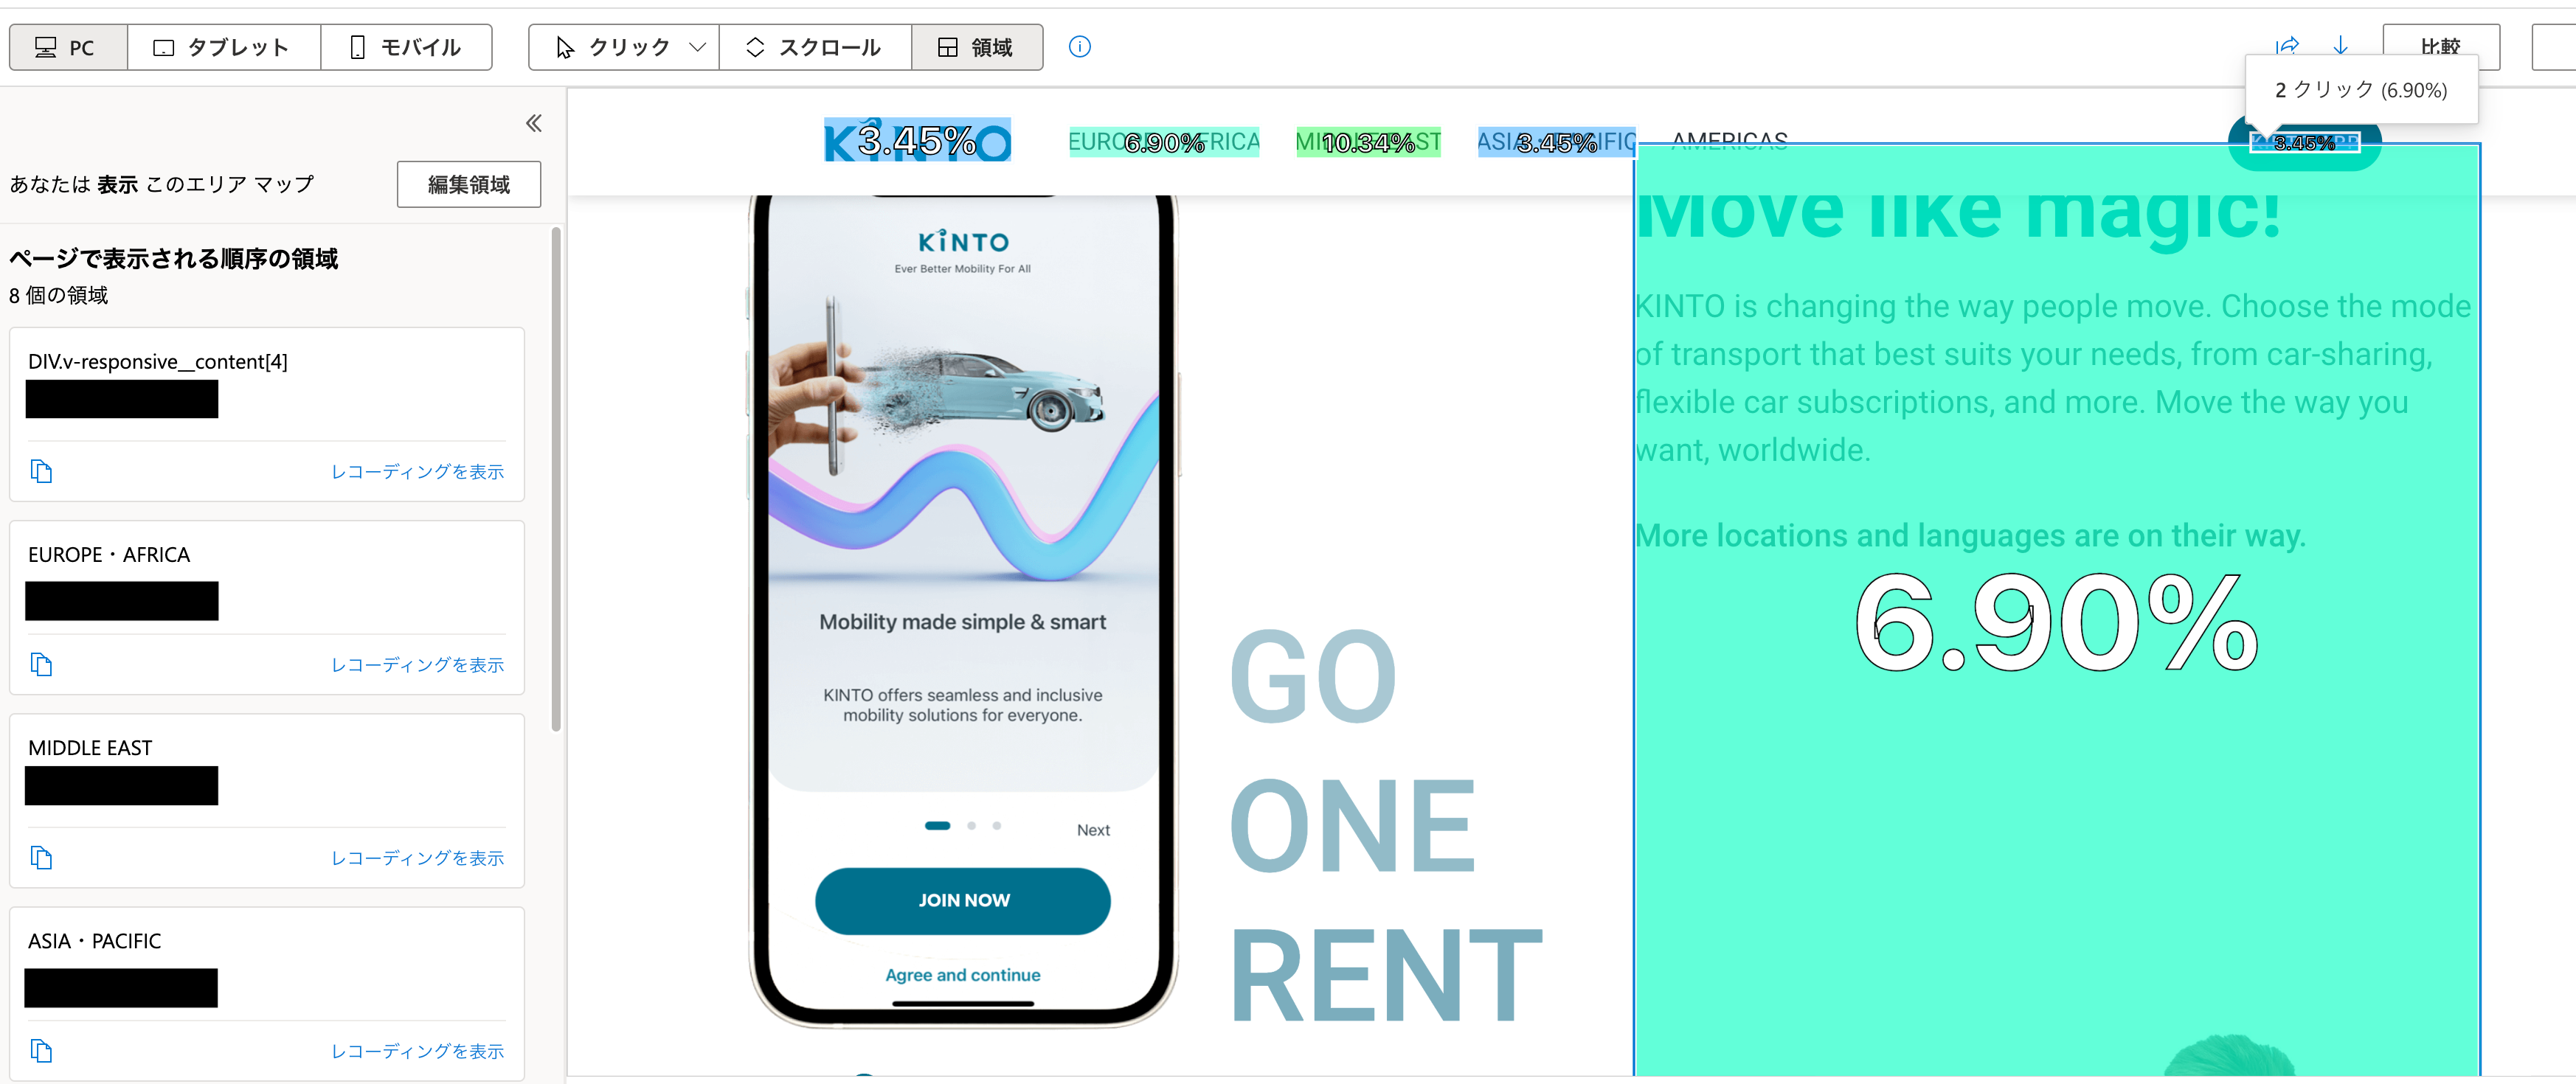
領域ヒートマップ(Click Area Heatmap)
領域ヒートマップはクリックヒートマップとほぼ同じ機能していますが、広いエリアでクリックされている箇所が確認することができます。ページ内に配置されているコンテンツが読まれてるかはわかります。
Area maps
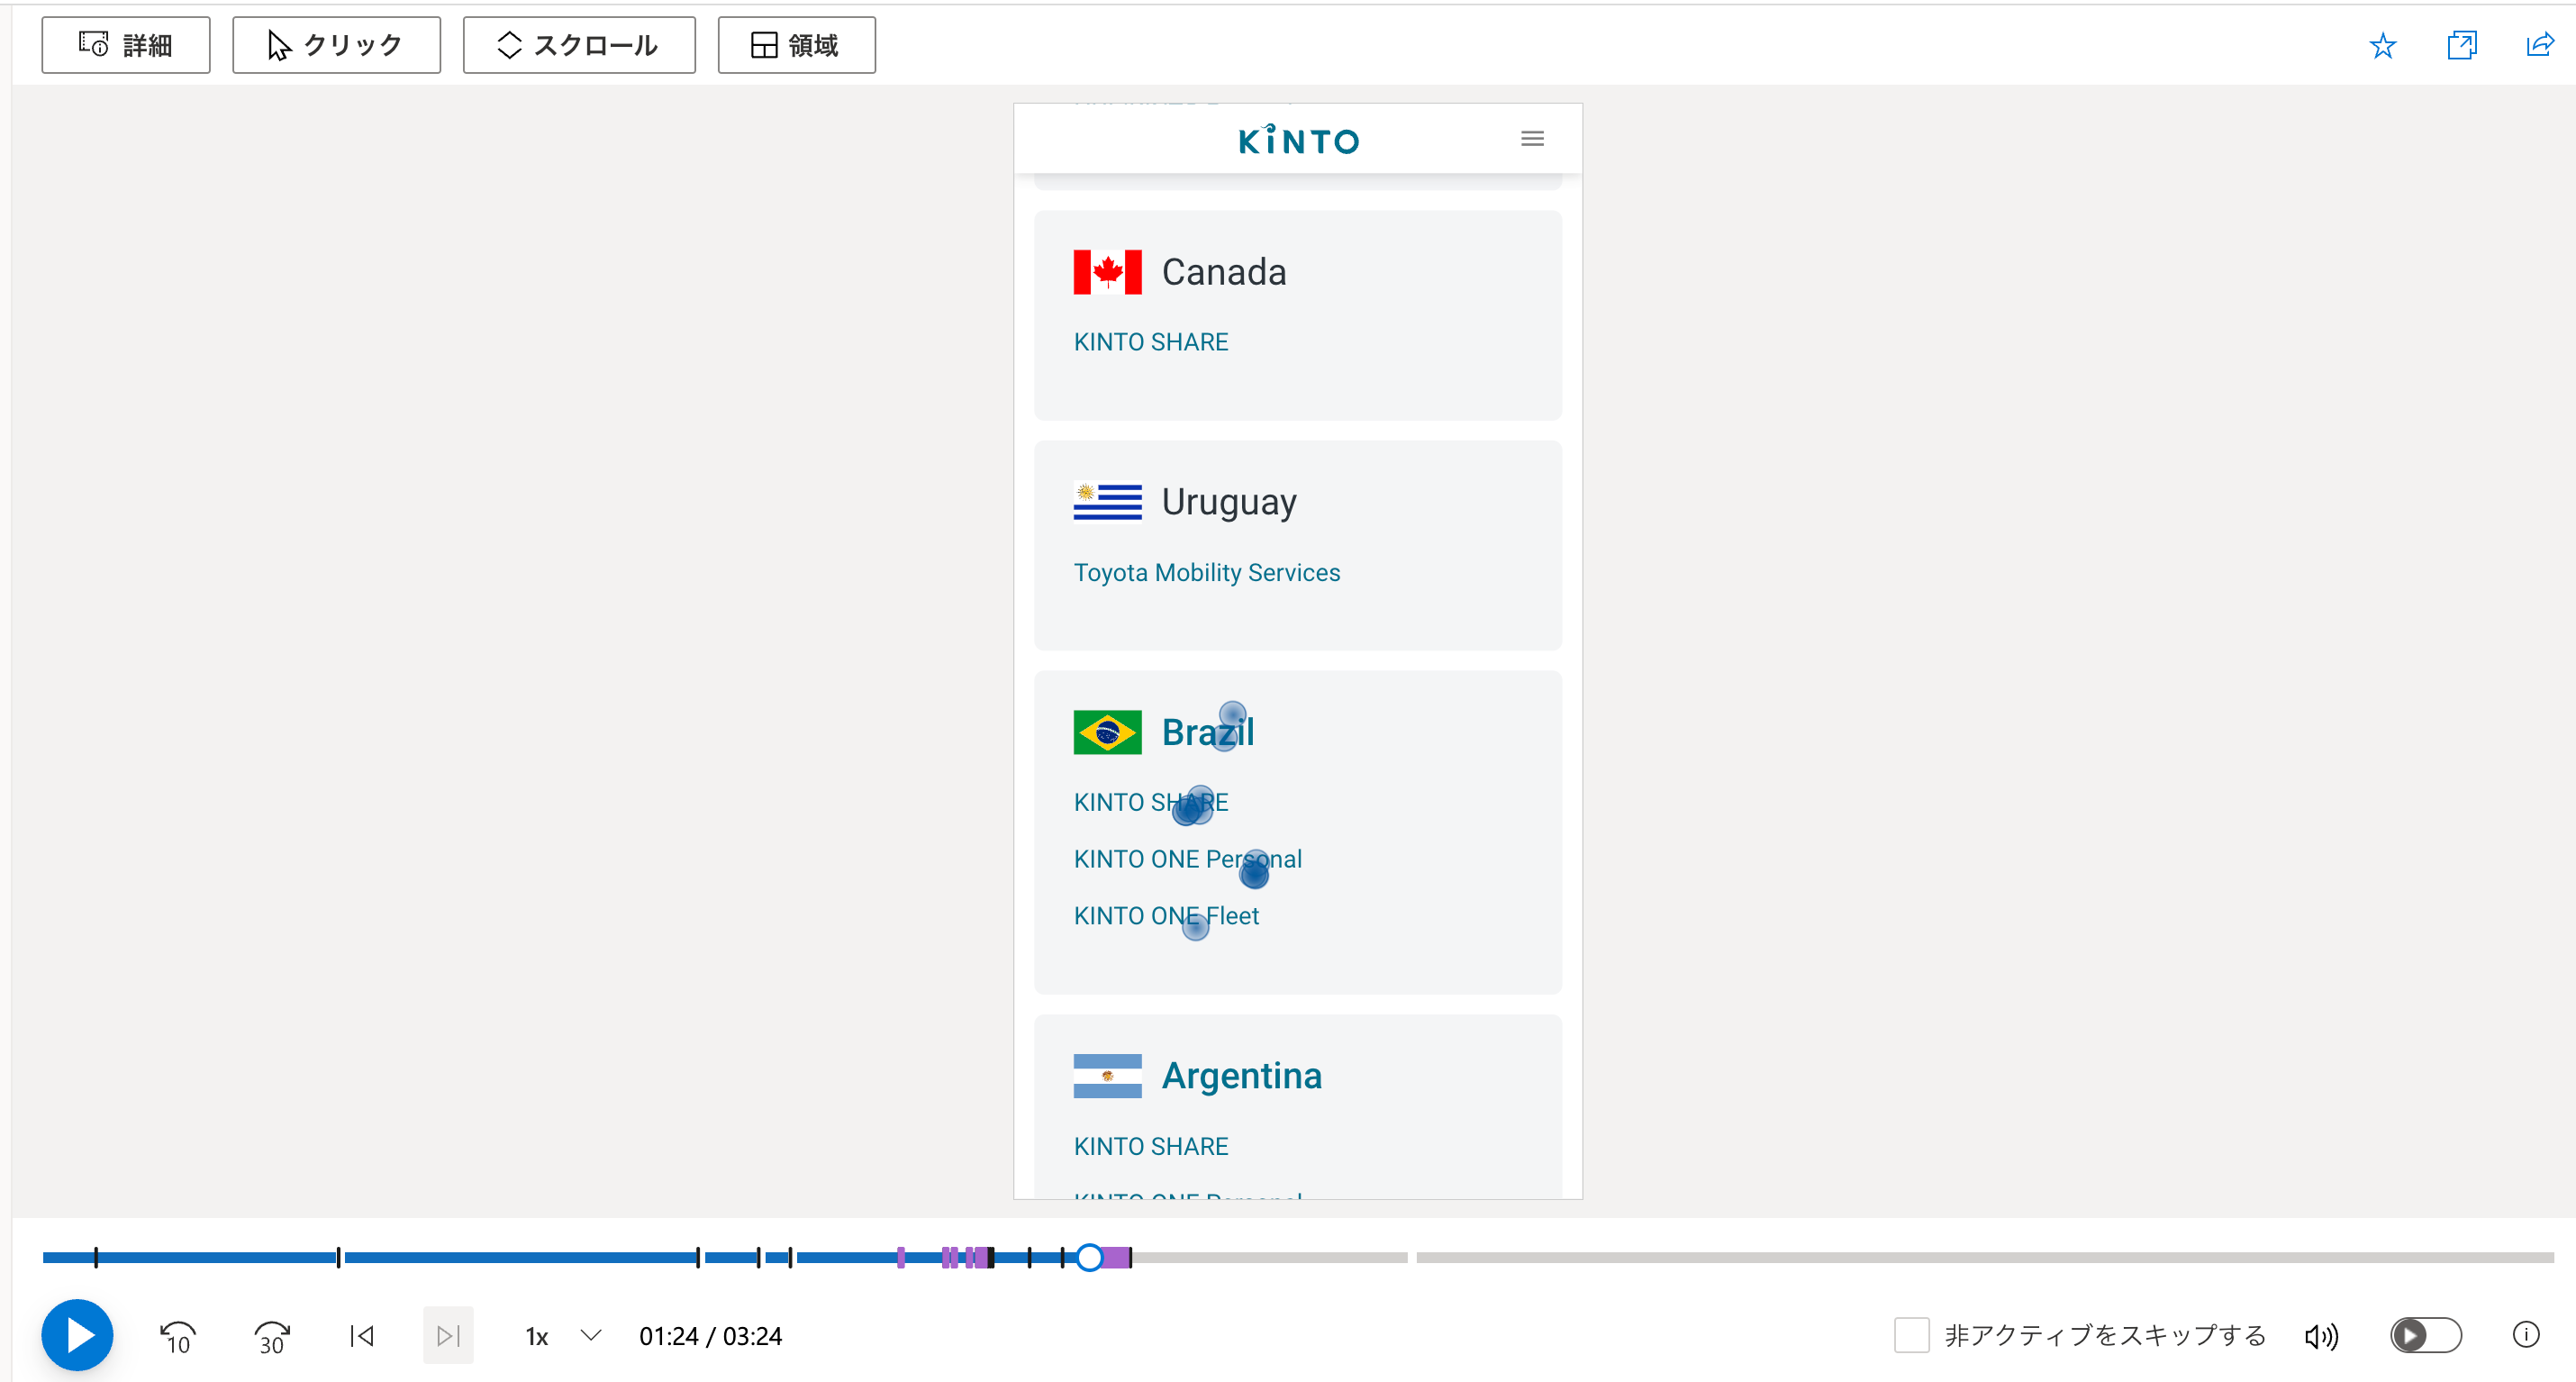
レコーディング
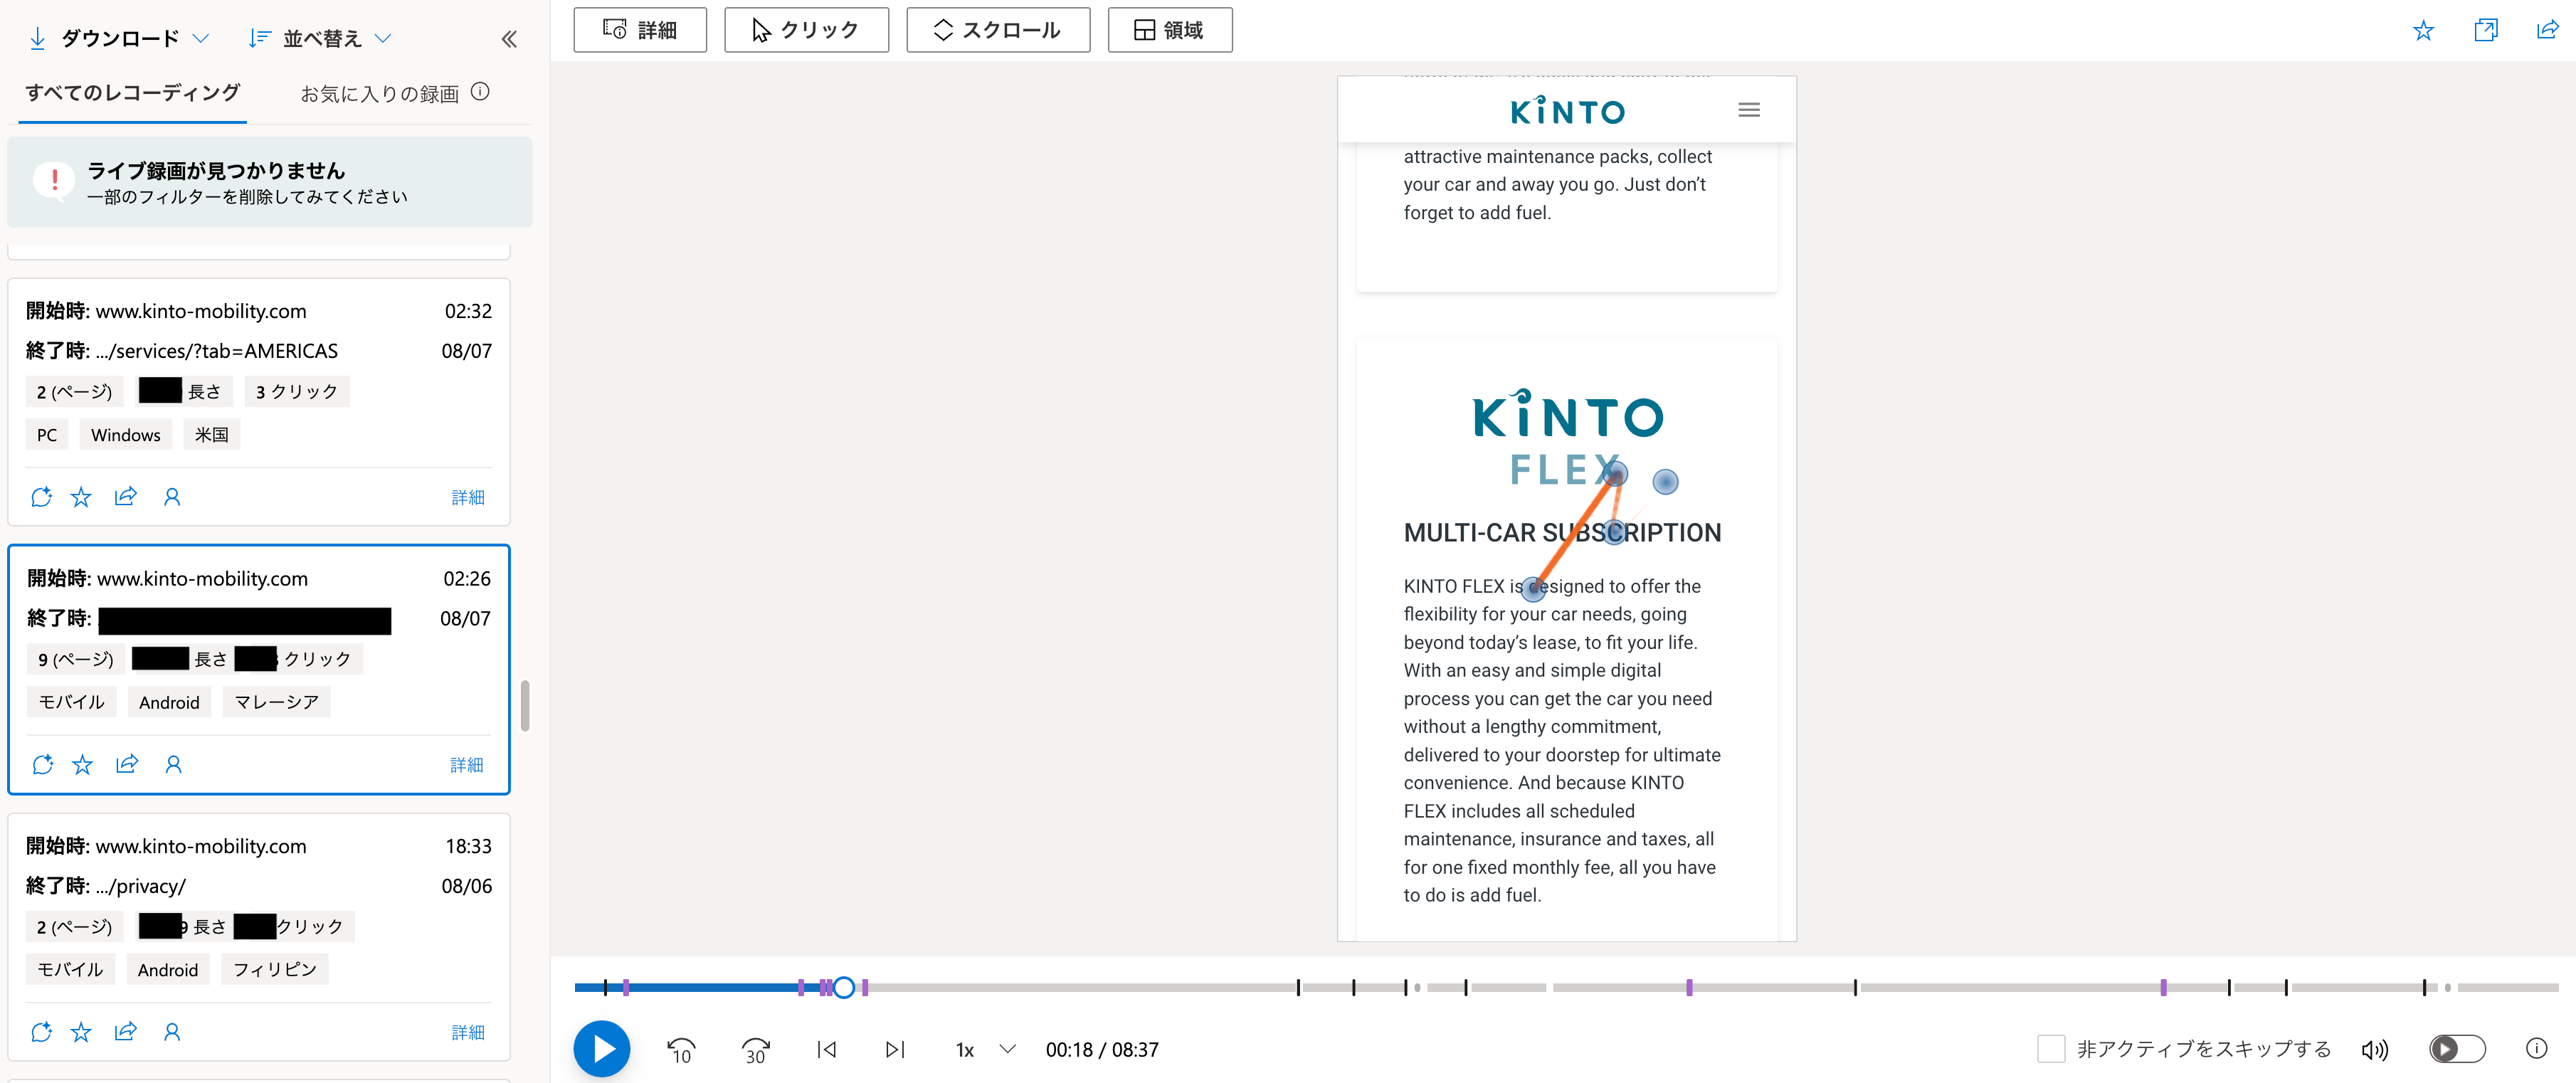
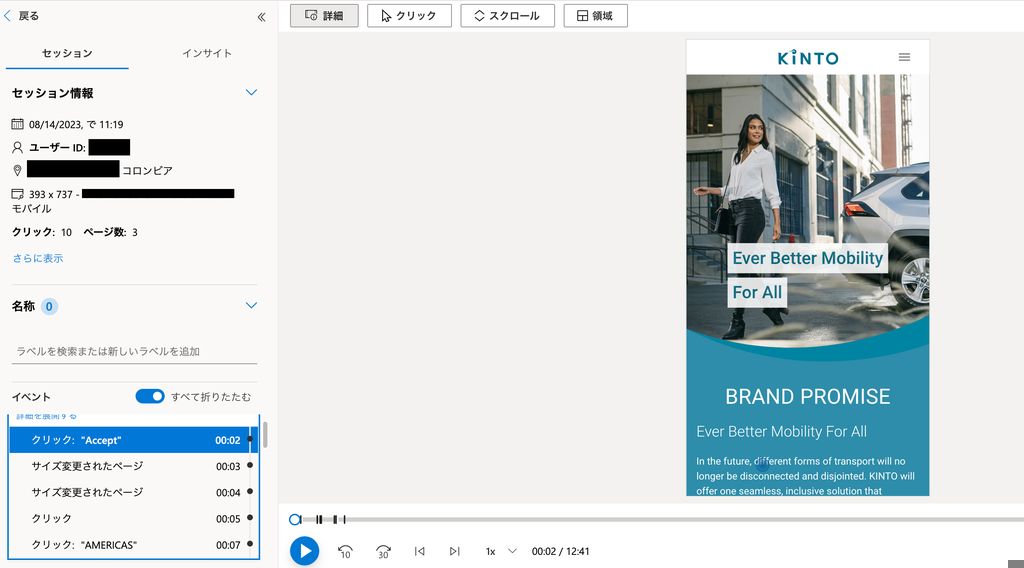
ユーザーのリアルな行動が記録されます。マウスのカーソルの位置、ページのスクロール、ページの遷移、クリックの動きを動画から確認できます。
また、端末の情報、地域、クリック数と観覧したページ数、終了のページ情報も左側メニューから確認できます。
ユーザーの一連の行動履歴を動画でリアルに見れるのはClarityの一番の魅力かもしれません。
Recordings overview
最後に
Global KINTO Webはまだまだ発展途上で、改善の余地があるWebサイトです。今回、ヒートマップの導入を決めてから、Clarityのクオリティとその導入の簡単さから、約半月(0.5人月)でリリースすることができました。現時点でフル活用できているわけではないですが、今後はこのツールをベースに、よりよいユーザー体験を提供すべく動いていきたいと思います。
関連記事 | Related Posts
Microsoft Clarityを導入してみた
Improving CWV Scores Through Kaizen Day and Study Sessions
My experience as an application engineer in KINTO Technologies
Performance Optimization in KINTO Factory

From Words to Worlds: The Magic of Amazon QuickSight Generative BI
Building a Speedy Analytics Platform with Auto-Expansion ETL Using AWS Glue
We are hiring!
ビジネスアナリスト(マーケティング/事業分析)/分析プロデュースG/東京・大阪・福岡
デジタル戦略部 分析プロデュースグループについて本グループは、『KINTO』において経営注力のもと立ち上げられた分析組織です。決まった正解が少ない環境の中で、「なぜ」を起点に事業と向き合い、分析を軸に意思決定を前に進める役割を担っています。
【UI/UXデザイナー】クリエイティブ室/東京・大阪・福岡
クリエイティブGについてKINTOやトヨタが抱えている課題やサービスの状況に応じて、色々なプロジェクトが発生しそれにクリエイティブ力で応えるグループです。所属しているメンバーはそれぞれ異なる技術や経験を持っているので、クリエイティブの側面からサービスの改善案を出し、周りを巻き込みながらプロジェクトを進めています。